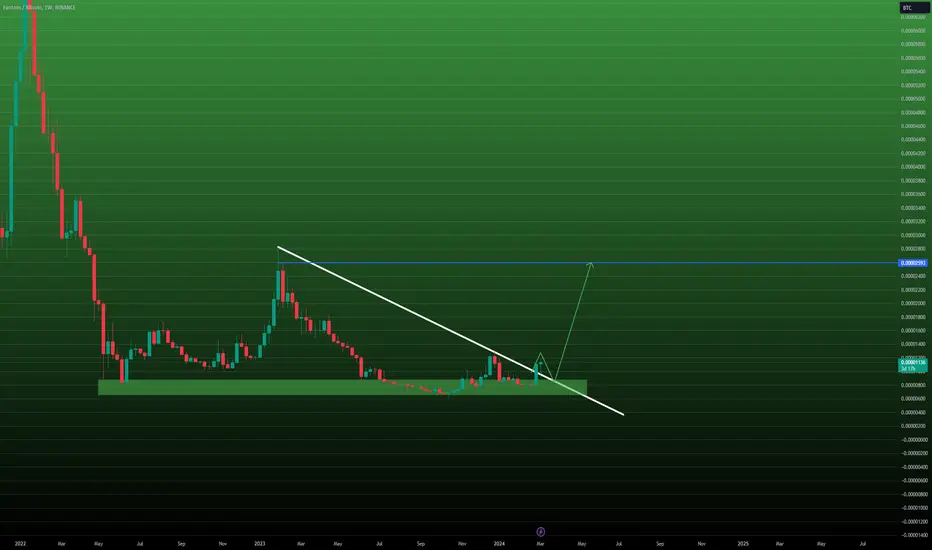
FTM/BTC breaking through long-term down-trend? Looking at the previous ATH and the down-trend that started at, it seems like FTM is breaking through the downtrend slowly and steady. Yet to be confirmed
Related pairs

Fantom Trading Tips | 120% - 160% BU-Pot.Hello dear reader, more than TA, these are "chart setups."
We are looking to spot potential bullish reversals early.
There is a trick with the "early" part.
➖ Being early can be great because one can enjoy the full move once it develops, if it develops according to our reasoning.
➖ The disadvant

Fantom price prediction UPCOM:FTM
The price prediction for Fantom (FTM) suggests an average market price of $1.45 by the end of 2024. By 2027, holders could see a maximum price of $2.38, and by 2030, FTM might reach $4.88, driven by increased institutional adoption.
The crypto market has been a breeding ground for inno

FTM BTC Pair DailyIf you’re looking to understand when altcoins will start to pump, it's important to pay attention to their performance against BTC pairs, not just USDT pairs. Checking BTC pairs can give you better insights into altcoin movements.
Today, we’re analyzing FTM/BTC. It’s currently pulling back to a bro


Alternatively, FTM/BTC also looks bullish FTM/BTC also looks bullish.
Broke out from rising channel and has retested on the 4 hr. If it can close above on the daily, that would be a good sign to enter, as breakouts from rising channels are v bullish.
Happy trades,
CD

Weekly Analysis of FTMBTC 📈FTMBTC was following a downtrend line on the weekly timeframe and has successfully broken out of that trend line.
We expect to see some good growth from it 🚀
Targets to consider:
0.00002470
0.00003487
0.00004708
FTM/BTC - Fantom: Failure Swing◳◱ On the $FTM/ CRYPTOCAP:BTC chart, the Failure Swing pattern suggests momentum building up for a significant move. Traders might observe resistance around 0.00000841 | 0.00000871 | 0.0000094 and support near 0.00000772 | 0.00000733 | 0.00000664. Entering trades at 0.00000806 could be strategic, a

FTMBTC LongFantom is about to break out of a super bullish chart formation, the Falling wedge will bring FTM 20x it's current value in BTC. Currently, 1 BTC = 100k FTM. Soon, 1 BTC will = 5k FTM. You're welcome.

Fantom (FTM) - Bullish divergenceEveryone is so focused on what Bitcoin is not doing that there’s a real risk the best opportunities are passing us by. Those opportunities are found in the alt tokens following massive sell offs. We find them by studying the BTC pairs. Those studies are assisted by focusing on time frames greater th

See all ideas
Summarizing what the indicators are suggesting.
Oscillators
Neutral
SellBuy
Strong sellStrong buy
Strong sellSellNeutralBuyStrong buy
Oscillators
Neutral
SellBuy
Strong sellStrong buy
Strong sellSellNeutralBuyStrong buy
Summary
Neutral
SellBuy
Strong sellStrong buy
Strong sellSellNeutralBuyStrong buy
Summary
Neutral
SellBuy
Strong sellStrong buy
Strong sellSellNeutralBuyStrong buy
Summary
Neutral
SellBuy
Strong sellStrong buy
Strong sellSellNeutralBuyStrong buy
Moving Averages
Neutral
SellBuy
Strong sellStrong buy
Strong sellSellNeutralBuyStrong buy
Moving Averages
Neutral
SellBuy
Strong sellStrong buy
Strong sellSellNeutralBuyStrong buy
Displays a symbol's price movements over previous years to identify recurring trends.