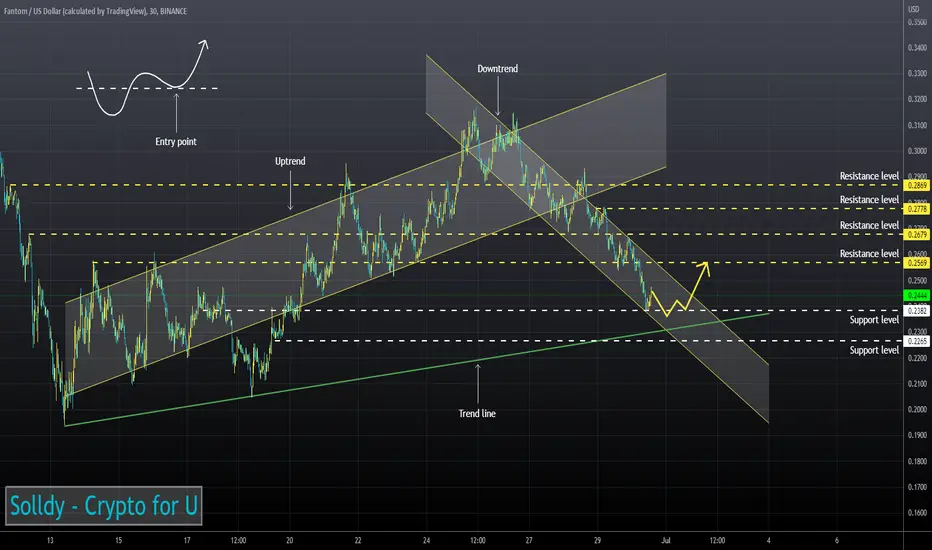
FTMUSD ❕ Is it the end of declining?Fantom is moving in an upward channel within the liquidity zone.
Trading volumes show uncertainty.
Price has tested 100MA as support.
FTM has moved into the bullish zone RSI (30m TF)
I expect the continuation of growth after fixing above the resistance level.
FTMPERP trade ideas

FTMUSD - SHORTHey guys. Some distro happening. Could be accumulation but it doesn't look promising.
SHORT TP: $.06
EZ clap :)


FTM possible bounceMarket looks like it will stop falling for now. There is short term accumulation.

FTM LONGThis is my short-term analysis, of course short-term there are dangerous changes, please see my chart for a good way.


FTMUSD ❕ strong levelsFantom holds a strong support level.
TD Sequential - up reversal signal (30m, 1H and 4H TFs)
Price has exited the oversold zone of the RSI (30m and 1H TFs).
BB indicator - the asset is oversold (4H TFs)
I expect that FTM may retest the support level, but after fixing above it will start to bounce.
FANTOM PATH TO $10 MINIMUM..Fantom shows strenght for a next wave to ATH. Still looking at the project a minimum of $10 should be achievable.

FTM 1h longSetup: In these kind of relief rally, you are looking to long crypto that outperforms BTC and has broken out of its accumulation phase. FTM is one of them. it has broken out of its accumulation range for both its US and BTC pairing with volume supporting it.
Entry: 0.29125
Trailing SL: Trial using the SAR indicator
TP: 0.36

FTM, along the trend line.The following are machine translations:
In the 4-hour chart, it rebounded in the medium and long-term period, and the low point of the callback was gradually raised, forming an upward trend line, and this rebound was walking along the upward trend line. At present, a short-term downtrend line has also formed to suppress and step back. The medium and long-term uptrend line and the short-term downtrend line form a triangle shape, which is gradually narrowing, and the direction is about to be selected. A step back to the uptrend line is now possible, try a short long.
From the perspective of indicators, the energy column of the macd indicator is gradually approaching the zero axis, forming a bullish trend. The rebound of the RSI indicator is blocked at the neutral 50, and the bears are stronger than the bulls, and they may step back near the oversold zone.
In operation, judging from the indicators and the current trend, it is possible to step back on the rising trend line, but at the trend line, the RSI indicator may reach an oversold state, and the macd is still in an upward trend, so do it at the rising trend line. More, looking at the vicinity of 0.42, below the trend line point stop loss.

milked this rangecollected profit at the lows and reentered shorts at the highs lol
i expect a relief rally soon

FTMUSD (1H) Bearish reversalHi Traders
FTMUSD (1H Timeframe)
Waiting for the downward break of 0.396 support level which will complete a bearish trend reversal pattern to go SHORT. Only the upward break of 0.437 would cancel the bearish scenario.
Trade details
Entry: 0.396
Stop loss: 0.437
Take profit 1: 0.372
Take profit 2: 0.334
Score: 7
Strategy: Bearish reversal

ftmits interesting to see fair value consolidating in previous sell tales
with macro headwinds hawkish and token unlocks happening every month, its hard for me to long here
perhaps thats the sign // fade myself...long

Luna Vs Fantom (why FUSD is not a good idea)hello everyone,
over the last few weeks we have seen a crypto by the name of LUNA collapse, why? here's why and why fantom could follow LUNA
Luna first started crashing when its algorithmic stable coin UST lost its peg to the US dollar. how did it lose its peg? here's why: there was massive withdrawals from Anchor ( a terra based decentralized protocol that offers high yields. it is believed that this was a attack on the system that made UST and Luna collapse (death spiral)
now that we got that out of the way we have to look at the similarities between LUNA and FTM:
basics:
both coins are POS (this system uses validators that have a large portion of coins staked)
both have algorithmic stable coins (different from USDT that is backed by the US dollar) FUSD and UST are backed up by different things, like LUNA and FTM
TA:
looking at LUNA and FTM you can see that they have similarities, from the start:
LUNA:
FTM:
LUNA:
FTM:
LUNA:
FTM:
LUNA:
FTM:
LUNA:
FTM:
i think that FTM is following the same path as LUNA, if this is the case the estimated top is around June 26th, 2023 at a price of $6 (thats how long it took for LUNA to go from stage 3 bottom to stage 4 top)

FTMUSD ❕ stronger than other cryptocurrenciesThe FTM has exited the upward channel.
Price has consolidated above the 100MA on the 4H Timeframe.
The 100MA broke above the 200MA on the 1H Timeframe.
Trading volumes are expressing interest in the rise of the coin.
I expect that after the correction the price may test the resistance level. If Fantom will consolidate above the resistance level, growth continuation is possible.

Fanthom Fathom what nice bear divergence on 1H timeframeFanthom Fathom what nice bear divergence on 1H timeframe
Where are you heading?
Up or Down to 0.35?
NAF DYOR


FTM Double TopFTM shows a clear double top (bear formation), like other top alts ( in a more shy way). Others show also double top but last peak higher is than the first one (like BTC), but we should imho play safe and considerer double top the same.
Due to the delicate macro situation, pre war cenario, inflation, tax rates, sp500 double top, btc domination rise, and so on, I believe 99% of all crypto will go more downwards than up, during a long period of time: 12-18months.
I may be wrong of course.
Good luck.

FTM, breaking the downtrend.The following are machine translations:
In the 4-hour chart, after the rebound, the shock was supported at 0.3. At present, it broke through the downtrend line and rose, and continued to be bullish, with the upper resistance at 0.6. The operation has stabilized and stabilized on the last step.

FTMUSD BUY The price of fantom against the US dollar in the last two sessions reaches a maximum in the area of 0.4607 usd, which represents a rise of approximately 28%, the price was forming a kind of triangle, when these figures are normally given they are for impulses and that benefits buyers, from a structural point of view it favors purchases in the breakout zone of the figure at 0.3651 usd

FTM Indicators are oversoldFTM is trading within these descending parallel channel. Monitor for YELLOW trend breakout.
FTM nearly reset the entire hype phase returning to it's lowest levels. Now FTM can recover and deliver on the programs fundamentals.
Once $1 clears, this will be explosive.
Good Luck

