FTMPERP trade ideas

BUY LIMIT @0.99?What do you all think of my setup anyone else running this setup if so I would like to know . And if not I would like to know where you would enter the market. highlight what you think I did wrong . if you would like to correct me or add an opinion be my guest everyone is welcome. God Bless

Fantom: Bullish OutlookEarlier this week, Fantom attempted to break above the resistance at $1.39 but has so far struggled to sustain the upward momentum. We assume that the sharp pullback to $1 early last week has marked the completion of the green corrective wave . Accordingly, Fantom should now be in the impulsive ascent of the green wave , which should soon surpass the $1.39 resistance.

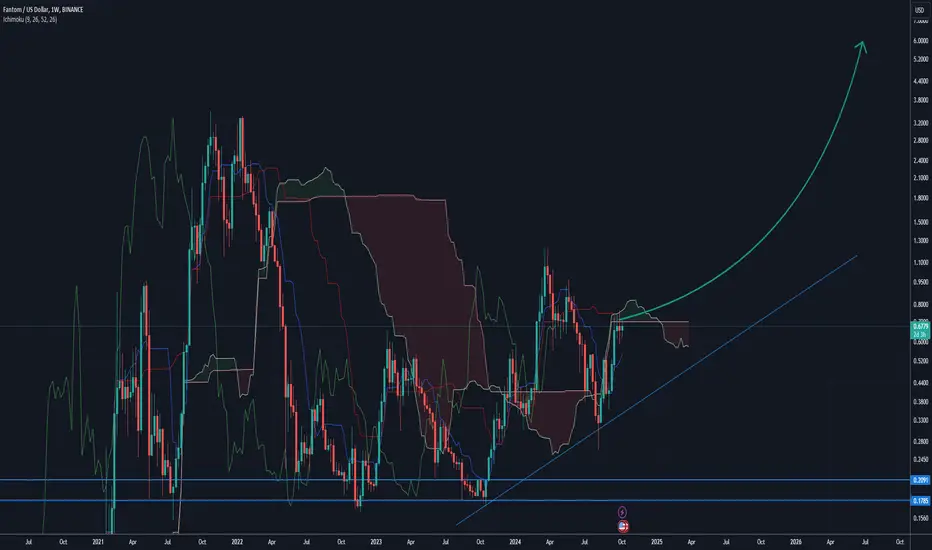
Ftm to the moonWe broke out of a huge wedge in weekly time frame.
Two ascending channels have shaped.
3.5 is the first target which if broken successfully we can soar to the top of the channel.

FTM_Nice setupWait for a confirmed breakout with volume.
The redline is a hurdle on the way up, if we break with confirmation.
TP levels are on the chart.
NFA

Fantom(based on NEowave)this is just the start but wait for the correction(wave G) and buy for huge targets. it can hit 120$ in a year and 200$ in 1/5 year.

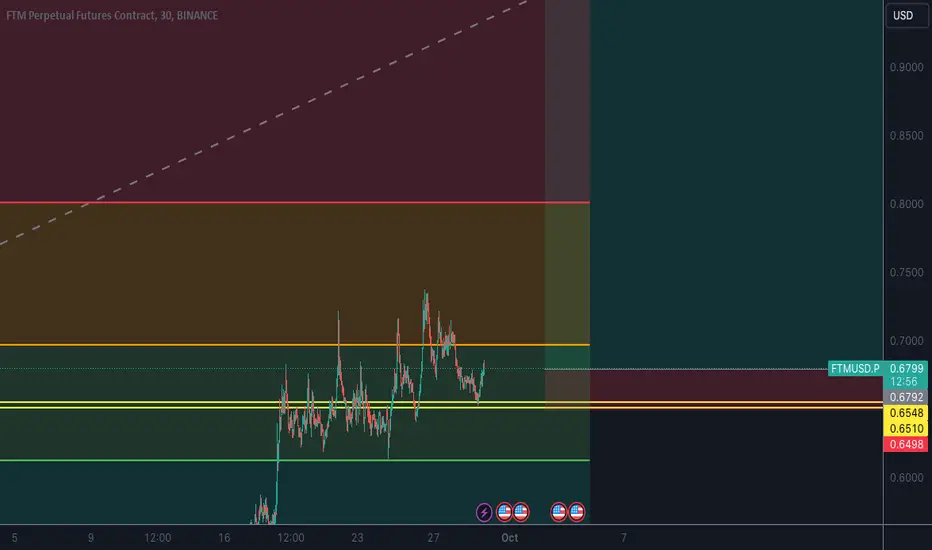
FTM LongFTM is currently testing resistance at $0.71 as it enters a price discovery phase. The chart forms an early-stage symmetrical triangle pattern accompanied by positive momentum indicators. This pattern suggests a period of consolidation, where the price is likely to move sideways within a narrowing range. The 200-day moving average is acting as a key level for a potential breakout, while the MACD suggests an imminent surge. Given these factors, the outlook for FTM appears bullish, favoring long positions.
Support - 0.62
Resistance - 0.76
RSI - Neutral
Fear & Greed Index (Binacne) - 48 Neutral
Fundamental Analysis:
Fantom's approaching transition to the Sonic platform creates positive investor sentiment and contributes to its recent price appreciation. This EVM-compatible upgrade promises enhanced transaction speeds exceeding 10,000 TPS and includes a substantial airdrop of S tokens for existing FTM holders. Given these developments and the improving market landscape, analysts project that FTM may outperform significant cryptocurrencies like Bitcoin and Ethereum in the coming quarters, potentially positioning it as a notable player in the evolving blockchain ecosystem.

Fantom (FTM)Fantom needs no introduction, a popular project which maintained its usefulness as well as high trading volume. After FTM price skyrocketed, a corrective wave started which seems ended at 0.382 Fibonacci retracement. The 0.382 area is a strong and important one since it was able to supported price several times; if this area breaks downward, for any reasons, the grey line below can come to rescue. Anyway, it seems an upward impulse wave has started and currently price consolidating in a triangle shaped pattern. If price breaks this consolidation area upward it means continuation for the impulse wave. Let's see what happens.

FTM CylinderPublishing to track Fantom's possible breakout from the cylinder it's been forming for the past 2+ years of accumulation.
$2 should be the near term target. With the BTC move and the FTM announcements, if there was ever a cycle for FTM to follow the ETH, AVAX, SOL type of moves, it's this one.
Heading into resistance now, but if it can clear the 1.2-1.3 zone, it should start moving. Depending on the climate when it reaches the second zone in gray, this has a good chance to pick up steam.


FTM to 1.4$FTM I expect to run to 1.2-1.5$ in December, this token has been consolidating and waiting for a while, a real dark horse. When FTM becomes S, we really need a coinbase listing for a long-term success of this token, the fact it is not listed is actually obnoxious to me. I have been in the FTM ecosystem for a very long time and wait for the day we finally see the listing. We could really see this one run next year 5-15$ tbh, I do not have any sell targets for myself here since I want to see how this plays out.

FTM USDT weekly bull postingbeen slowly grinding up here after this beautiful HTF gartley played out
been chopping up at this level for a bit though & would like to see expansion soon to Weekly FVG
could look for longs on a raid of the internal low inside the local Daily FVG for a move higher
otherwise would wait to see if we can flip ice lines into support if we just pump here


FANTOM is about to rise as WAVE 5 hi traders.
as seen in fantom chart, we are completing wave 4 as an falling wedge. i think after wave e and gaining some momentum we can have a rise as wave 5 .
#DYOR

FTMUSD Trade setupAccumulate in this area, FTM is primed in Q4 2024 - Q1 2025. Sonic will generate new ATH's.

#FTM FANTOM COIN LONG POSSIBILITY - ALTCOINI will be watching to marked 'Long Zone' for possible long position.
LTF confirmation will be needed in order to open position.
Possible target would be the purple line.
Risk assests are doing good recently but we have still geopolitical risks currently.
Nothing i share is financial advice. Education purposes only.

FTM LONG Bears failed to drop the price below 0.6 .
0.58 - 0.55 demand zone acting as strong support. Coincides with golden zone for current wave retracement between 0.5 and 0.618 fibs.
Bulls fully in control from here. Next target for long TP : 1.02.

FTM Short : Bulls ExhaustedLooks like bulls are exhausted from recent up trend. 1.618 fib point should have been the take profit for most long traders. Price broke below demand zone at 0.618 indicating increasing sell pressure. Same demand zone is now acting as supply zone (resistance that bulls have failed to break above.
Short position from here.

Head and Shoulders with price retestA drastic dip occurred with week buy action. FTM value has been reset to the low 0.60 zone. I expect a price bounce from the head and shoulder retract. I called a head and shoulder earlier this week on the XRP chart, and FTM has also followed that trend. 20MA and 200MA are still playing the break for all long positions. The moving average holds uptober excitement, but we will have to wait and see if it will hold strength and value next week.
Support - 0.56
Resistance - 0.65
Momentum - Low
Volume strength - Sell
Fear & Greed Index - Greed (73)
Fundamental analysis—With new price discoveries, it has been a rough week for all cryptocurrencies. I've noticed that the world crisis events will determine crypto price bounces. A lot of selling occurred with whale accumulation.

FTM update pushing momentumFTM is hitting the momentum Fib, the ever important signal of strength and momentum in my opinion. My late November target still remains pictured as the circle. There is moderate resistance around the next Fib but a wide range after that. The weekly stochastic might need a bit of a reset but the daily is just getting started. I would love a confirm above this Fib here, and then a pullback to build support above it.
Short- Term = a test of 85 cents
Mid term- my target Nov 11 =1.3$

Symmetrical TriangleFTM is breaking resistance for the third time. A possible Symmetrical triangle has formed to continue the upward trend. 200 MA is still playing the break. Value should play above resistance in the coming days, fighting for higher highs and new lows.

FTM Uptrend ContinuationPrice retraced and found strong support at demand zone around 0.65.
We can take another long position from here with SL slightly below low of the demand zone. TP should be around 1 USD.