FTM diamond topThis is a short term analysis of FTM. FTM failed to break the previous high on its uptrend it recently started and is due for a correction. With that we have what looks like a diamond top on the shorter timeframes. If this plays out the target is the 2.25-2.40 range.
*NOTE* Long term analysis looks quite bullish on FTM however.
This is not financial advice and, as always happy trading!
FTMPERP trade ideas

Lets try it #FTM !!We are seeing a Strong Long for $FTM so we are waiting for the price going up with the Trend and we hope we will se a ATH, if not we will see FTM at $2,50.
Lets wait and see the price then open a position.

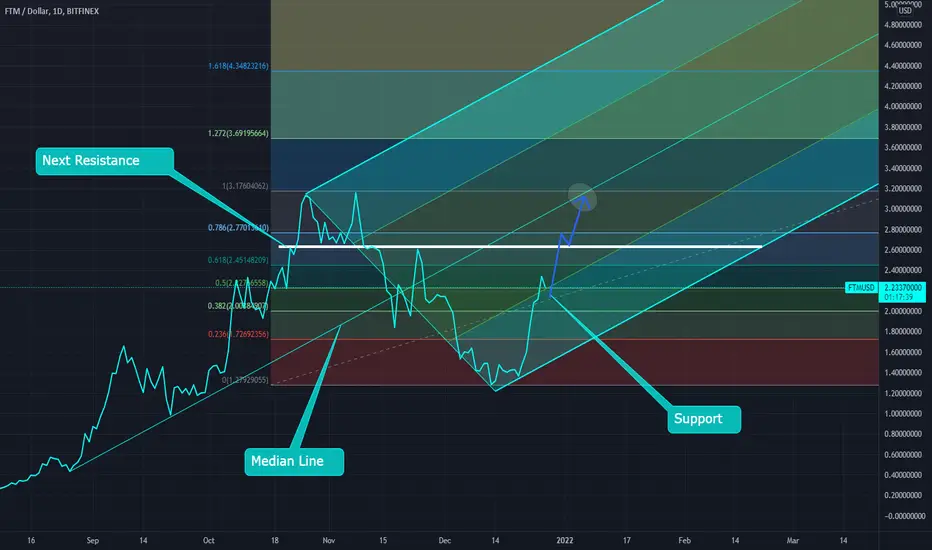
FTM finding supportFTM has completed the 1H IHS and is now trading within the pitch fork.
Before hitting the median line, FTM needs to flip the WHITE resistance line into support. But after the S/R flip is complete, the ATH should come really quick for FTM.
Good Luck
Junior blockchains are on a rollJunior blockchains like Polygon (MATIC) Cosmos (ATOM) and Fantom (FTM) show exceptionally strong performance, while the broad crypto market has pulled back quite a bit.
Which one will be the next Etherium?

ichimoku trade : long positionbreaking the cloud,green cloud in future,free laggingspan. best situation by ichimoku
buy at 2.40$
stop loss: 2.07$ and if it rise it would be kijunsen.

LONG FTM 2.78 TARGET 3.2 and 3.7the stoploss is at 2.60 which is yesterday's target, if price turns back from here we could get an extension down. The overall structure is bullish. I've just checked the 2 hrs time frame it shows that the bounce happened at its 38% which is a sweet zone for bounce. MY reasons to play long is that there's more growth opportunity than the decline probabilities from here. Yesterdays downfall was almost expected and quite violent, it was needed to shakeoff a few noobs which were long and induce a bear mindset, this is how the market gets you shorting the bottom while it goes slowly and steadily up. Yesterday we shorted the top now we long a bounce, it's the most probable trade to do
If you find this helpful please help by subscribing to ftx using my referral link, i'll be giving you quality signals for free here ,

FTM SHORT FROM 3.10 TARGETS 2.7656 , 2.653 and final targets 2.6This trade is a pullback to be traded on the 30 min time frame not 5min; it's a pullback trade so be cautious and just set the profits as mentioned in the title. my leverage X7 on ftx

FTM SHORTWe are expecting the price to get rejected at the resistance therefore it could be a good entry price for a short position.
FTM recovered very fast but we believe that it´s time for a pull back now as also RSI is overbought
We recommend a short position with a stop loss
No financial advice

FTMUSD Fibonacci correlationsIf we count $2.48 as the first complete move, this current high of $3.16 is the 1.618 extension. This total move accounts for 150%.
$2.89 is the .618 Fibonacci ratio for the move from 1 to 1.618. This is also where the last high volume cluster of volatility occurred. If we pull back here, I’ll be eyeing this range as the next support zone.

Fantom $FTM Moonshot - Is this possible? We can dream at least.The moon shaped weekly arc points to a possible $30-$80 FTM by the end of May. Not financial advice, don't FOMO. Yes, this is on the very optimistic observation but it's fun to dream, even if doesn't eventuate. My last fantom moonshot was clearly wrong as it had FTM at $10 by the end of december 2021. I'm having a second go.

Technical Analysis for FTM/USD. | Huge Profits for our follower Hi Traders,
I shared the Technical Analysis of Fantom FTM/USD before 2 days.
A Huge FLAG AND POLE BREAKOUT IN FANTOM. If you have took entry at our points, you would have made a Very - Huge profit.
SO If you have missed the trades then you can Consider our Next Points for Entry.
Note : Always use a Stop-Loss
Disclaimer : Crypto Trading involves a high risk. Make sure that you do your Technical Analysis too. Make sure that you don't use much leverage.

$FTM - Too expensive for a good trade?Since we had an extended wave 3, traders that hold FTM should take partial profits just above black wave 3.
I´ll only buy if we get a decent pullback for wave 4... if not, the risk reward ratio is not good enough for me.
If you´re a hodler, don´t worry about it. From a trading point of view, I´d be careful around current prices.

Fantom (FTM) all time high next door - looking strongFantom (FTM) all time high next door - looking strong.
The last breakout is confirmed on RSI and OBV as well - very nice.
What do you think? 😎
Drop me a nice comment if you'd like me to analyze any other cryptocurrency.
*not financial advice
do your own research before investing

Fantom ($FTM) New FIBFantom ($FTM) New FIB: $FTM mini-pump is "on the horizon" Oscillators showing strong support for more BULL-ish action. If you bought during the RED DAYS, congrats! We don't chase pumps, we buy dumps. If $FTM re-traces back to the 50MA, I would be very interested in buying

Fantom FTM Usdt breakout and retest of the all time highmessage me for any questions,
here i am using ichimoku, concencio moving averages and the resistance of the ath where i believe there is space for the price to move freely into and retest the All time high here.
we may also see a break out from the all time high having looked at the weekly chart, FTM hasnt really been affected by this downturn too much in the market and still is bullish printing a no, 1,2 and now 3 bullish candle (on the weekly Tom demark sequential)
My game plan here is to see a no8 print close to the resistance of the ath, take some profit, leave the rest, use trailling stop and wait for a break of the ATH.

FTMUSD patterns and gapsI’m concerned about the gap formed on 2H and 4H. It corresponds to support at $2.385. I won’t be surprised if we bounce down and fill this gap before continuing our trend. These patterns were looking very similar until this candle began to form. Now they’ve diverged and I’m short term bearish.

Fantom ($FTM) FIBFantom ($FTM) FIB: $FTM completes a nice mini-pump and gets rejected in a problem area as in the past. MACD and RSI support $FTM price action but as RSI crosses the upper limit, its the perfect time for a correction

FTM BULL FLAGFound this triangle breakout for FTM after some vertical movement.
Looks like a nice bull flag break that could see some BIG movement if BTC doesn't dump.
If btc goes to the 50k range soon,we could see FTM at 3-4$ easily.
Happy new year !

Huge Flag-Pole BREAKOUT in FTM/USDT | Technical Analysis Hello Traders!
There is Huge Flag-Pole BREAKOUT in 4Hr TimeFrame in FTM/USDT .
You can take a Perfect and Make some Out of it.
Always make sure that you use a Stop-Loss.
Disclaimer :- Crypto Trading involves a high risk. so make sure that you do your own research too.

$FTM wyck off distribution?FTM has had an amazing run-up, could be a beautiful wyck off distribution now?

FTMUSD in 12H time framesI would love for FTM to have a green weekend, but I'm not certain. At this and lower time frames, there's plenty of room for movement to $2.10, just based on mean regression. While this time frame pattern is encouraging, the current candle is less so. There is support at $2.16, so there's still a chance for a strong bounce out of this pattern but I suspect we will need a few more candles. RSI also shows a little room, and I'd like to see a nice low value before we try to move on.


FTMUSD bearish divergence and double topBearish divergence in the RSI and price pattern, and a bearish chart pattern with failed highs. Next support near $2.
