FTM-USD 15m chartFTM-USD Elliott wave
Target: 2.6
NO INVESTMENT ADVICE. The Content is for informational purposes only.
FTMPERP trade ideas

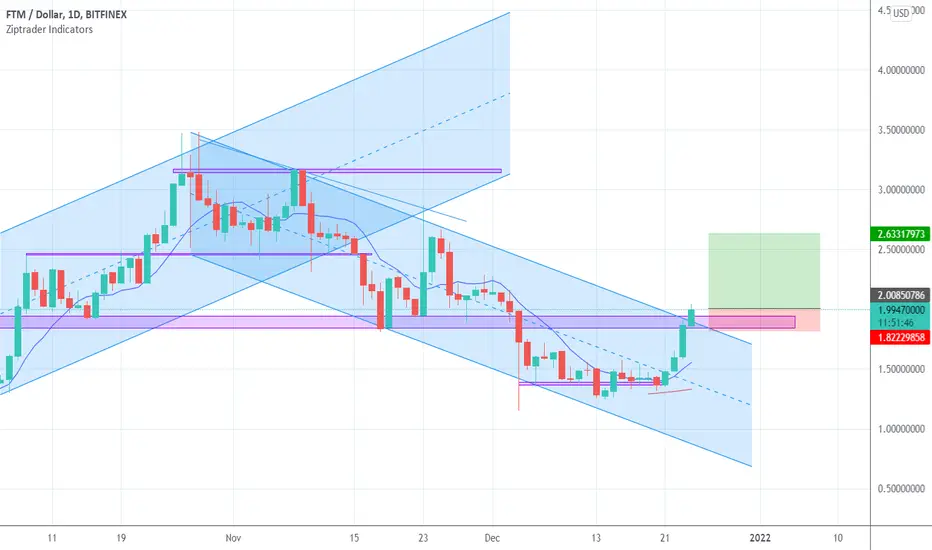
We have resistance above for FTM. Next level is 2.56If we break above 2.56 we'll be in a very bullish pattern, looking for new all time highs.
But, the Ichimoku cloud on the daily chart doesnt look very promising.
So, lets wait.

$FTM to 4.26$FTM breaks out and RSI is approaching 70. Very bullish. I expect FTM to reach 4.26 on this next bull run.
NOT FA/DYOR

FTM PUMP??Looking for some retracement here. I was lucky enough to catch that wedge break and break of trend. Looking at a cooldown period. That bubble has played out 3 times. If price gets there I will be loading the boat again! Follow me for more winning charts

Has down trend finally come to an end on FTM?I am bullish on FTM and identifying it as one of the biggest gainers in coming weeks. After finally breaking out of the down trend channel which had been in effect since late October, I am expecting FTM to at least equal its ATH of 3.5.

FTMUSD bottomFTMUSD printed an inverse head and shoulders, inside the mean regression range, at the bottom of an ABC elliott following the previous 12345 uptrend. This leads me to believe FTMUSD has bottomed. I'd like to see it close outside the mean regression channel on the 1D to confirm. I have done my buys within this range, and have staked it into liquidity pools on spookyswap, tomb finance, etc.

Stock up on FTMFTM broke out of a strong area of support/resistance as well as a downtrend channel. I am bullish on this setup. Wait for a confirmation of the breakout by the close of D candlestick.
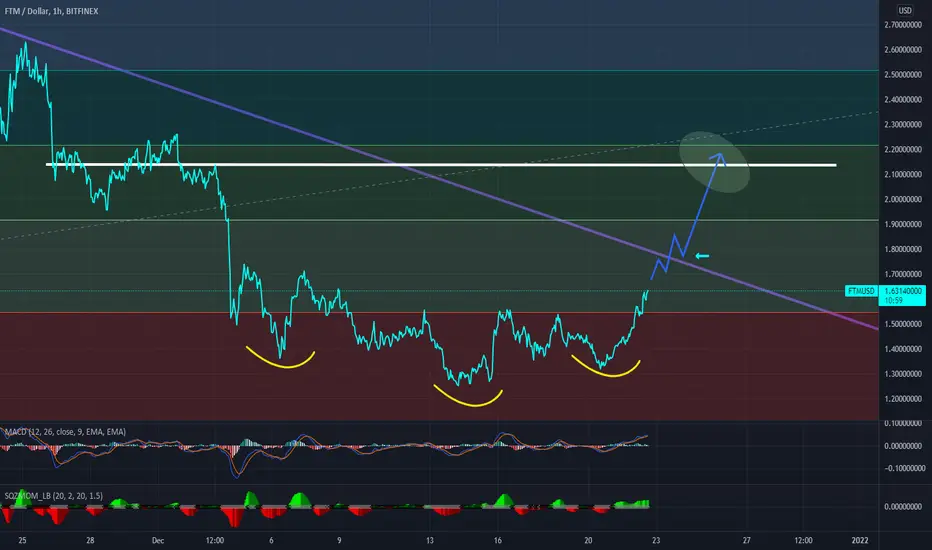
FTM IHS and trendlineFTM is forming an inverse head and shoulder pattern.
Once trendline breakout is confirmed FTM should rally up to $2.13 - $2.20 quickly
Good Luck
FTM: Possible bullish reversal on daily chartMomentum, wave trend, RSI are starting to point upwards again. Trend is showing positive signs as well with a higher low.
I'm cautiously optimistic about FTM's consolidation being done now. Let's see what happens with BTC's weekly close in ~45 minutes :D.
$FTM DO YOU SEE IT?FTM is a L1 that people seem to not talk enough about.
FTM is one of my favorite networks since Metamask can be used.
The network is also built to be a complement to ETH
This set up looks pretty good

Fantom FTMUSD Charting on the fly. Learn with me. Target $4.00! In this video:
* I chart on the fly with you all so that you can see how I do what I do
* I chart trendlines, levels, fibonacci, and bullish divergence on the 4 hr.
* We can see a longer term swing trade target of $4.00
Best of luck traders!


FTM/USD ChartBefore I start to talk about Fantom, I would be grateful if you could follow, like and comment your thoughts bout the idea.I will start to post 3-5 times a day starting on monday.
Let's begin to talk about BTC that has been facing bearish retests in the last week. I think that the lowest target that we can get on bitcoin is 44K on a daily close. If the BTC drops below 44K, we probably drop down to the 38K-40K range. On the other hand if BTC goes sideways until it reaches 44K and does a pull back to 47K, we might see bitcoin back at 50K.
FTM is looking to be a good altcoin to invest, and seems to be ready to a move to 2$ in the mid term. The coin has a good support at 1.22$, and a resistance 1.56$. Comment your thoughts on this.

FTM BUY OPPCould see a major pullback and then a huge runup to complete the parabolic curve...
RSI IS BEARISH
MACD IS BULLISH
VOLUME TAPERING OFF
DYOR
GOOD LUCK

SHAKEOUT DONE PUMP IT LOOMDARTsitting at short-term support on the 15min after whiplash price action. longing here

Where will $FTM be on 12/31/21?Price predictions for $FTMUSD EOY?
The price points and pathways are purely arbitrary guesses. I don't usually trade FTM so I will only provide an upward trending channel (also acting as resistance) and a few other key resistance points that I think we need to break in order to climb higher.
$4.20 magnet anyone?

FTMUSD's Broken ZoneThe 1.2859 is a lower high of 1.3429 which is kept by 1.4114 that got broken
The price is bearish towards 1.0872 for a bias of 0.9516
.
Khiwe
On this profile page, the shared analysis, ideas, and also, the strategy of a chart belong to Khiwe with some being influenced. The technical set-ups are speculative, they are not guaranteed for accuracy or completeness in the form of any content; it is not to advise on financial markets. Please apply your own analysis and confirm it with price action.

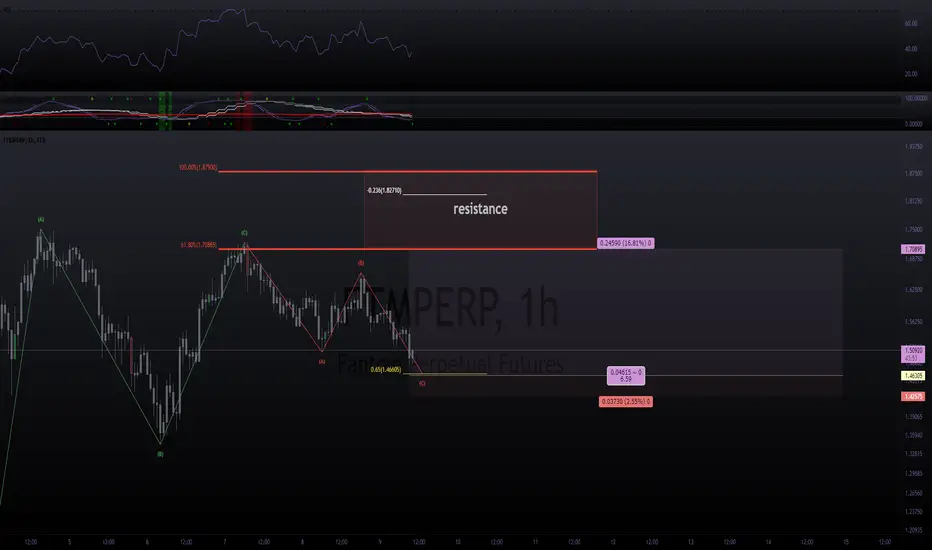
Possibility to buy FTM on dip and make 28%Uncertainty in market. The time on FMT hit the nearly the rock bottom at Fibonacci's 23.6% will exactly match with the time of FDS making an announcement on further actions. It will either be a good time to buy FTM or a time for FTM to drift past its big resistance level and reach the lowest price since September.

Target 1.895Following 4h chart.
There is a powerful support around 1.42
RSI has also support around 40, this is a long signal for me.
TP 1.895
SL 1.39
Please wait for candle close to close the position.

FTM Price prediction. Megaphone Pattern. VERY Conservative price prediction of $4.32. in the next month.

Fantom ($FTM) New FIBFantom ($FTM) New FIB: $FTM doing a good job staying above the 200MA as the RSI avoids trading under the lower limit. MACD could see some improvements. Death Cross is on the horizon

FTM can move up to $2.5 in the next weeksFTM hit 2D demand zone recenty. I think that there will be more accumulation in this zone and then a price move towards $2.5 will happen, into 1D supply zone.

ftm swing ~our indicator is picking up a nice buy signal right here in this lower region ~
ftm looks solid for a swing from this local golden zone --> to the 0.618% extension.
it can certainly go higher, but i'm out at the first sign of weakness.
if you take this one with me, keep an eye out for my exit, or just move your stops up as it goes.
----
buy - 1.466
target - 1.70