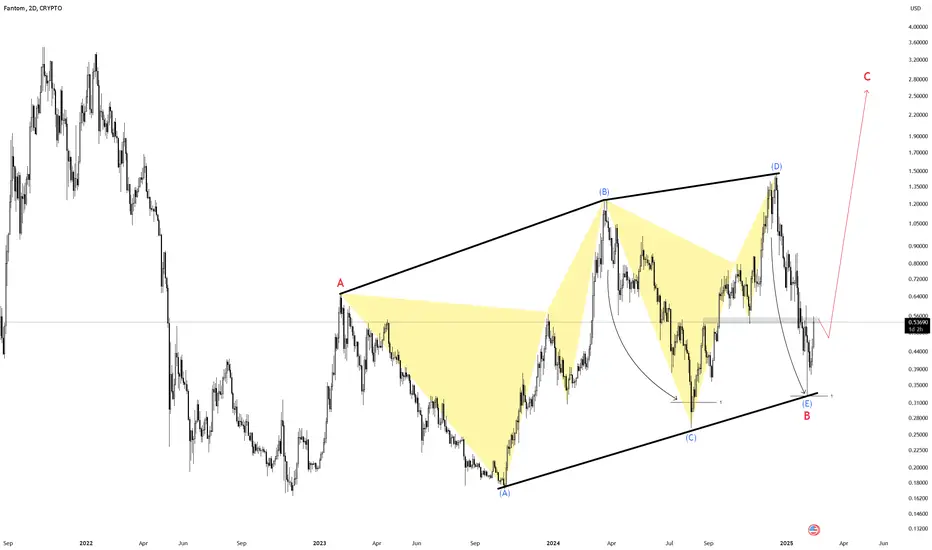
FTM - Time to Lock In for a 2x Ride to $1?Fantom ( UPCOM:FTM ) is sitting on its key floor support zone. A level that has historically triggered 50% to 100% pumps. Now, price is coiling within a triangle and looks ready to break out.
Could this be a start of a run to $1?
Let me know your thoughts below!
Kindly support this idea with a LI
Key stats
About FTM
Launched in 2019, Fantom is a smart-contract compatible network, built with a focus on providing the infrastructure needed for DeFi. It aims to address the ‘blockchain trilemma’ through the use of its ‘Lachesis’ consensus mechanism which (in theory) allows the network to be decentralized, secure and scalable — all at the same time. Its native token FTM is used for staking, paying fees, and governance of the ecosystem and as a layer 1 network, it has positioned itself as a competitor to Ethereum. Although it still has a long way to go before it can take on the king of DeFi.

FTM/USD 1D ChartHello everyone, let's look at the 1D FTM to USD chart, in this situation we can see how the price is moving in a descending triangle where we are approaching the moment of trying to choose the direction in which the price can go further.
Let's start by defining the targets for the near future that

SUSDTSUSDT is showing a bullish dragon pattern at clear historical levels presenting an asymmetric opportunity for a long position.

FTM/USD target 20 ### **Analysis of FTM/USD Chart (Monthly Timeframe)**
1. **Cup Formation**:
- The chart shows a **rounded bottom pattern**, indicating **accumulation** and a potential long-term bullish reversal.
- The **blue curved line** suggests a cup-like structure, commonly seen before a **paraboli

Sale?!Ftm . Phantom is in a down trend, meaning we are in a downward correction, awaiting a return of selling.
This is not financial advice.

FTM cup and handle?I found a cup and handle on FTM. Needs to hold the 0.5 fib. take profit at 0.76427

FTM udpate#FTM i made an analysis on this coin before its rising spike and i was sure that this coin can make a real move ! the pattern is special and unique the funda things are positive check this out

FTM/USD 8H possible correction?Hello everyone, let's look at the 8H FTM to USDT chart, in this situation we can see how the price has broken out of the local downtrend line, which it is currently moving above.
Let's start by defining the targets for the near future that the price must face:
T1 = $0.75
T2 = $0.86
Т3 = $1.02
Т4 =

Sell?!!!@Ftm..There is a high probability of entering into a correction after that, continuing to decline because the general indicator is still giving us a downward trend. As long as we do not see a change in the trend towards an upward trend, we are in a downward trend. This is just an analysis and not fin

FTM IS EXPLODING !#FTM has a real potential coin which is going to rise as soon as possible
the whole pattern is really clear and we are sure that this coin will rise higher than its last ATH so its better to wait and see what will happen also this coin has a real good news and fundamental as its going to turn into
See all ideas
Summarizing what the indicators are suggesting.
Oscillators
Neutral
SellBuy
Strong sellStrong buy
Strong sellSellNeutralBuyStrong buy
Oscillators
Neutral
SellBuy
Strong sellStrong buy
Strong sellSellNeutralBuyStrong buy
Summary
Neutral
SellBuy
Strong sellStrong buy
Strong sellSellNeutralBuyStrong buy
Summary
Neutral
SellBuy
Strong sellStrong buy
Strong sellSellNeutralBuyStrong buy
Summary
Neutral
SellBuy
Strong sellStrong buy
Strong sellSellNeutralBuyStrong buy
Moving Averages
Neutral
SellBuy
Strong sellStrong buy
Strong sellSellNeutralBuyStrong buy
Moving Averages
Neutral
SellBuy
Strong sellStrong buy
Strong sellSellNeutralBuyStrong buy
Displays a symbol's price movements over previous years to identify recurring trends.
Curated watchlists where FTMUSD is featured.

DeFi Tokens: Finance 2.0
24 No. of Symbols

Gen 3 crypto: A new day dawns…
25 No. of Symbols

Smart contracts: Make the smart decision
36 No. of Symbols
See all sparks
Related pairs
Frequently Asked Questions
The current price of FTM (FTM) is 0.4832 USD — it has risen 1.74% in the past 24 hours. Try placing this info into the context by checking out what coins are also gaining and losing at the moment and seeing FTM price chart.
FTM price has fallen by −5.82% over the last week, its month performance shows a −8.87% decrease, and as for the last year, FTM has decreased by −35.69%. See more dynamics on FTM price chart.
Keep track of coins' changes with our Crypto Coins Heatmap.
Keep track of coins' changes with our Crypto Coins Heatmap.
FTM (FTM) reached its highest price on Dec 16, 2024 — it amounted to 1.4750 USD. Find more insights on the FTM price chart.
See the list of crypto gainers and choose what best fits your strategy.
See the list of crypto gainers and choose what best fits your strategy.
FTM (FTM) reached the lowest price of 0.1642 USD on Nov 22, 2022. View more FTM dynamics on the price chart.
See the list of crypto losers to find unexpected opportunities.
See the list of crypto losers to find unexpected opportunities.
The safest choice when buying FTM is to go to a well-known crypto exchange. Some of the popular names are Binance, Coinbase, Kraken. But you'll have to find a reliable broker and create an account first. You can trade FTM right from TradingView charts — just choose a broker and connect to your account.
Crypto markets are famous for their volatility, so one should study all the available stats before adding crypto assets to their portfolio. Very often it's technical analysis that comes in handy. We prepared technical ratings for FTM (FTM): today its technical analysis shows the sell signal, and according to the 1 week rating FTM shows the sell signal. And you'd better dig deeper and study 1 month rating too — it's sell. Find inspiration in FTM trading ideas and keep track of what's moving crypto markets with our crypto news feed.
FTM (FTM) is just as reliable as any other crypto asset — this corner of the world market is highly volatile. Today, for instance, FTM is estimated as 11.22% volatile. The only thing it means is that you must prepare and examine all available information before making a decision. And if you're not sure about FTM, you can find more inspiration in our curated watchlists.
You can discuss FTM (FTM) with other users in our public chats, Minds or in the comments to Ideas.