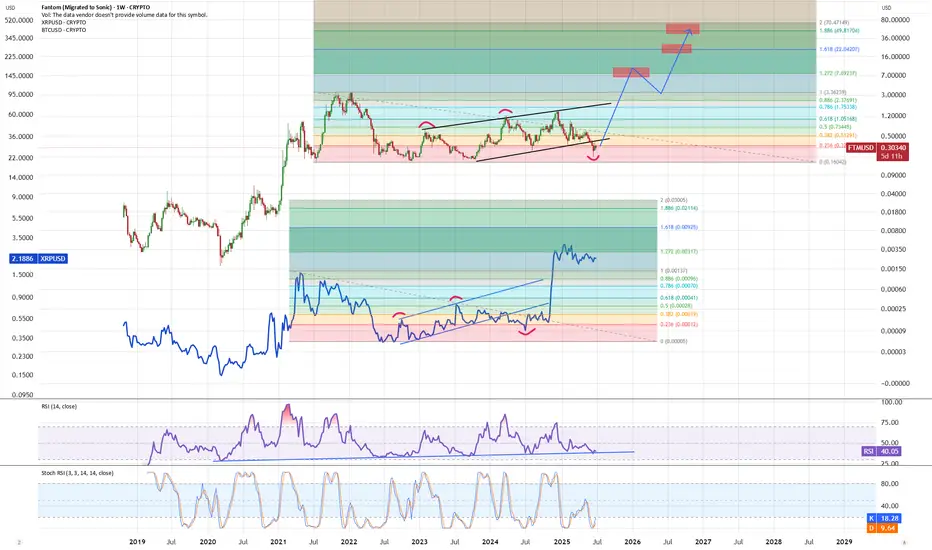
FTM - time to fly...FTM is sitting at major RSI support line and has done same pattern as XRP before it pumped up. It also did last capitulation dip, from here on no new lows allowed! Expecting push back up into the channel and then blast toward new ATH - fibb 1.272 being likely 1st target before bigger correction which should flip current ATH level into support. After that one last push higher for blowoff top to complete this cycyle....
FTMUSD trade ideas
ftmusdt sonicThis is my idea and not a buy recommendation. I'm just waiting for a 20% correction. Leaving this here as a memento

FTM/SONIC about to make moves.
Not sure to be bullish or bearish for the next 2 weeks but i believe big move are about to happen especially towards the end of this month.
I'm thinking we can either go down to $0.16/$0.17 quickly, or make it to 1.90/$2.00 towards the end of October with a bounce at $1.00 down to $0.80/$0.85
Factors:
Rising channel can be followed all the way back from Nov 2018, turning resistance into support for this long term trend. We have stayed within it since may 2022.
Has been consolidating at the bottom of this channel since February 2025.
RSI and MACD are flipping Bullish on the daily.
Alt season is starting to get talk about.
BTC playing with ATH.
Lots of long term support being bounce off of although this will be the 4th retest of support in my eyes.
shortest term descending channel just broke to the upside with a retest currently in play.
SONIC just announced a distribution of coins.
Sonic is a great project in my eyes and growing.

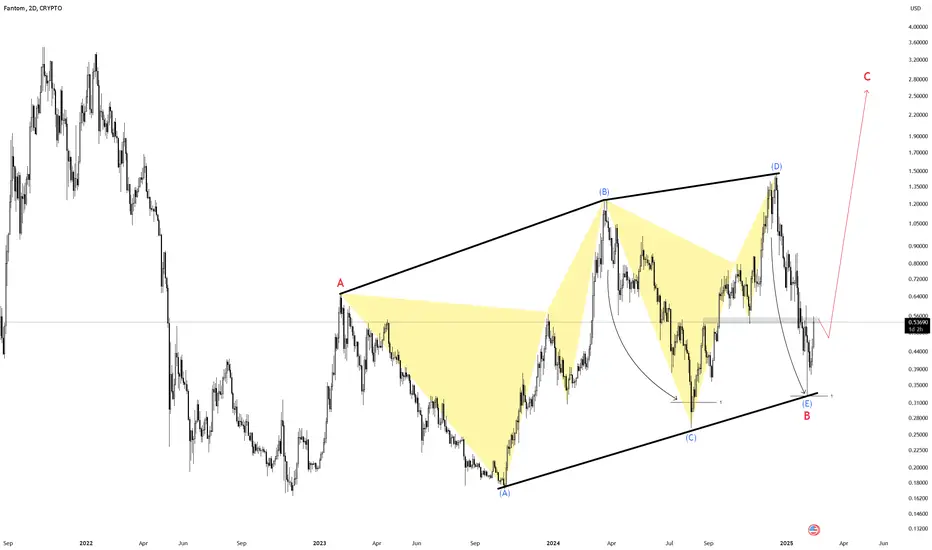
FTMusdt or Susdt pattern for long , i think this pattern will be valid if we can hold dynamic support .


Fantom-FTMUSD Periodic Analysis-Issue 83 (Free Access)The analyst believes that the price of Fantom(sonic) will decrease within the time specified on the countdown timer. This prediction is based on a quantitative analysis of the price trend.
___Please note that the specified take-profit level does not imply a prediction that the price will reach that point. In this framework of analysis and trading, unlike the stop-loss, which is mandatory, setting a take-profit level is optional. Whether the price reaches the take-profit level or not is of no significance, as the results are calculated based on the start and end times. The take-profit level merely indicates the potential maximum price fluctuation within that time frame.

Fantom (FTM/USD) Target: $3Fantom (FTM/USD) shows a classic cup and handle breakout setup forming around the $0.57–$0.59 buy zone. The breakout looks strong, backed by volume and bullish momentum.
📈 Buy Zone: $0.57–$0.59
🎯 Target: $3
⏳ Timeframe: 4–6 months
🔄 Pattern: Cup & Handle
💡 Note: A breakout above $0.63–$0.65 could confirm the next wave.

S/USDTI have been watching S/USDT formerly FTM for some time now, on the Sonic chart there is a clear bullish bat pattern that hasn't yet caught a reaction or formal type I return.
On the FTM chart the same bullish bat is visible but is also happening inside a 139 day large bullish dragon.
The weekly MACD oscillator is showing bullish divergence with negative momentum decreasing at this key support resistance level.
I think its equitable to take a long position here based on the technicals targeting the hump and top of the dragon pattern.
Trade safely, stay hydrated.

FTM - Time to Lock In for a 2x Ride to $1?Fantom ( UPCOM:FTM ) is sitting on its key floor support zone. A level that has historically triggered 50% to 100% pumps. Now, price is coiling within a triangle and looks ready to break out.
Could this be a start of a run to $1?
Let me know your thoughts below!
Kindly support this idea with a LIKE👍 if you find it useful🥳
Happy Trading💰🥳🤗

FTM/USD 1D ChartHello everyone, let's look at the 1D FTM to USD chart, in this situation we can see how the price is moving in a descending triangle where we are approaching the moment of trying to choose the direction in which the price can go further.
Let's start by defining the targets for the near future that the price has to face:
T1 = 0.66 USD
T2 = 0.81 USD
Т3 = 0.93 USD
Now let's move on to the stop-loss in case the market continues to fall:
SL1 = 0.44 USD
SL2 = 0.31 USD
SL3 = 0.21 USD
If we look at the MACD indicator we can see a return to a local downtrend, however we are still in a place where the trend can reverse and surprise us with growth.

SUSDTSUSDT is showing a bullish dragon pattern at clear historical levels presenting an asymmetric opportunity for a long position.

FTM/USD target 20 ### **Analysis of FTM/USD Chart (Monthly Timeframe)**
1. **Cup Formation**:
- The chart shows a **rounded bottom pattern**, indicating **accumulation** and a potential long-term bullish reversal.
- The **blue curved line** suggests a cup-like structure, commonly seen before a **parabolic breakout**.
2. **Current Price & Target**:
- **CMP (Current Market Price)**: **$0.62**
- **Target**: **$15 - $20** within 1 year (high-risk, high-reward trade).
- The upside target suggests a **~24x - 32x move** if the breakout occurs.
3. **Resistance Levels to Watch**:
- **$1.15 - $1.70**: Initial resistance zone
- **$3.35**: Mid-term breakout level
- If price sustains above these, **exponential upside is possible**.
4. **Suitability**:
- The note suggests it is **for aggressive traders**, indicating **high volatility and risk**.
- Patience is needed for this setup to play out.
### **Conclusion**:
- If momentum continues, **FTM/USD could see a strong rally**.
- A breakout above **$1.15 - $1.70** could confirm a **major bull run**.
- **High-risk, high-reward trade**—position sizing is key.

Sale?!Ftm . Phantom is in a down trend, meaning we are in a downward correction, awaiting a return of selling.
This is not financial advice.

FTM cup and handle?I found a cup and handle on FTM. Needs to hold the 0.5 fib. take profit at 0.76427

FTM udpate#FTM i made an analysis on this coin before its rising spike and i was sure that this coin can make a real move ! the pattern is special and unique the funda things are positive check this out

FTM/USD 8H possible correction?Hello everyone, let's look at the 8H FTM to USDT chart, in this situation we can see how the price has broken out of the local downtrend line, which it is currently moving above.
Let's start by defining the targets for the near future that the price must face:
T1 = $0.75
T2 = $0.86
Т3 = $1.02
Т4 = $1.19
Now let's move on to the stop-loss in case the market continues to fall:
SL1 = $0.60
SL2 = $0.49
SL3 = $0.42
SL4 = $0.32
It is worth looking at the RSI indicator, which shows how strongly we have broken out of the upper limit of the range, moreover, here we can see how we have touched the level of 81, at which price rebounds were previously visible.

Sell?!!!@Ftm..There is a high probability of entering into a correction after that, continuing to decline because the general indicator is still giving us a downward trend. As long as we do not see a change in the trend towards an upward trend, we are in a downward trend. This is just an analysis and not financial advice.

FTM IS EXPLODING !#FTM has a real potential coin which is going to rise as soon as possible
the whole pattern is really clear and we are sure that this coin will rise higher than its last ATH so its better to wait and see what will happen also this coin has a real good news and fundamental as its going to turn into sonic platform so its technically and fundamentally good for investing
FTM (SONIC) 40 % profit !#FTM or #S is one of my favorite coins !
this coin has a real potential for rising !
the fundamental analysis is positive and the technical is perfect !
we are almost in 40% OF PROFIT 1X !
check out my last analysis on this coin !

FTM low time frame update#FTM pattern tells us that the market is ready for a big rise
the pattern was a bind of an uptrend and a down trend the down trend wanted some liq to be stopped and it took this liq from stop losses and now its hungerness is done !
just because of the bearish pattern in the whole market we have 2 scenarios once is rising from here and the other one is rise after another down
there is a real positive pattern in higher time frames check this out

FTMUSD-TO-SUSD Chart From The BeginningFriends, please look at the base trend line coming from the beginning. It also shows that the support value will be 0.26 Dollar around in THESE DAYS (18-40 Days). Besides that targets are on the chart according to the parallel speed and resistance lines going upward. Supports are too, on the chart. Let's see how such a name changing absurd will result. If I were FTM Project- lab owners, I had preferred ''Fantom'' as a name instead SONİC and wouldn't change.


FTM still bullishFTM dipped a bit more than the rest, but bullish structure still intact. Early profit takers are gonna regret it imo. Looking to sell my bags around 4,2$, slightly above range high. NFA.
