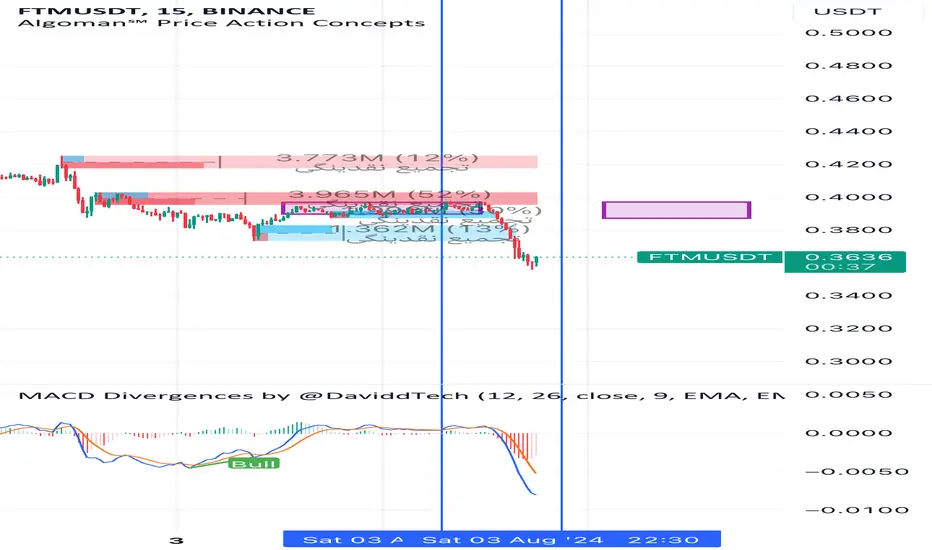
Alikze »» FTM | Continue reforming on the descending channel🔍 Technical analysis: Continue reforming on the descending channel
- In the analysis presented in the previous post , after leaving the density to the first blue strip area it made the first correction.
- Currently, it is moving in a downtrend in a downtrend in a downtrend.
- Depending on the type of behavior and structure of this return, it can extend to the middle of the channel or the Test of the Neckline area.
- So we will expect to continue the correction after the middle of the channel to the floor of the canal, which can then continue with the channel breakdown to 0.26.
- This correction is generally for the completion of the 2 -correction wave that can have a complex combination modification.
- So we will continue to consider the upward trend after the short -term correction is completed.
💎 Alternative scenario: After supporting the blue and money -wide range, it can have a test to the supply area, which can continue up to the channel and fibo 1.272 if it fails.
»»»«««»»»«««»»»«««
Please support this idea with a LIKE and COMMENT if you find it useful and Click "Follow" on our profile if you'd like these trade ideas delivered straight to your email in the future.
Thanks for your continued support.
Best Regards,❤️
Alikze.
»»»«««»»»«««»»»«««
BINANCE:FTMUSDT
FTMUSDT trade ideas

FTM - Daily bullish divergenceFor the RSI nerds out here ;) FTM is about to print a bullish divergence on the daily chart, these setups usually have a very high hit rate, so I will be risking a long here with a wider stop than usual. Playing it a bit more safe on the target, don't be too greedy :) If it goes up more so be it, but still a decent ROI overall.
Stay safe!

patern harmoni110import pandas as pd
import numpy as np
import matplotlib.pyplot as plt
import ta
def load_data():
data = pd.read_csv('historical_data.csv')
data = pd.to_datetime(data )
data.set_index('Date', inplace=True)
return data
def calculate_rsi(data, period=14):
data = ta.momentum.RSIIndicator(data , window=period).rsi()
return data
def detect_positive_divergence(data):
detected_patterns =
for i in range(1, len(data) - 1):
if (data < data and
data > data ):
detected_patterns.append((data.index , 'Positive Divergence'))
return detected_patterns
def detect_harmonic_patterns(data):
detected_patterns =
fib_ratios = {
'Gartley': ,
'Bat': ,
'Butterfly': ,
'Crab':
}
for i in range(2, len(data) - 2):
for pattern, ratios in fib_ratios.items():
high1 = data
high2 = data
low1 = data
low2 = data
if high1 < high2 and low1 < low2:
retracement = (high2 - low1) / (high1 - low1)
if ratios <= retracement <= ratios :
detected_patterns.append((data.index , f'Bullish {pattern}'))
elif high1 > high2 and low1 > low2:
retracement = (low2 - high1) / (low1 - high1)
if ratios <= retracement <= ratios :
detected_patterns.append((data.index , f'Bearish {pattern}'))
return detected_patterns
def plot_patterns(data, patterns):
plt.figure(figsize=(14, 7))
plt.plot(data , label='Price')
plt.plot(data , label='RSI')
for pattern in patterns:
if pattern == 'Positive Divergence':
plt.scatter(pattern , data [pattern ], color='orange', label='Positive Divergence')
elif 'Bullish' in pattern :
plt.scatter(pattern , data [pattern ], color='green', label=pattern )
elif 'Bearish' in pattern :
plt.scatter(pattern , data [pattern ], color='red', label=pattern )
plt.legend()
plt.show()
data = load_data()
data = calculate_rsi(data)
patterns = detect_positive_divergence(data) + detect_harmonic_patterns(data)
plot_patterns(data, patterns)
FTM (Fantom): Approaching SupportTrade setup : Price remains in a downtrend. It had a failed breakout from Falling Wedge pattern and pulled back to $0.40 support that held in early July. If it breaks below that, it could resume its downtrend and revisit $0.30 next.
Pattern : Price is Approaching Support , which is a level where it could pause or reverse its recent decline, at least temporarily. Support is often a level where price has bounced up in the past, or potentially prior Resistance level that was broken. (concept known as polarity). Once price breaks below support, it can move lower to the next support level. Learn to trade key levels in Lesson 7.
Trend : Short-term trend is Strong Down, Medium-term trend is Strong Down and Long-term trend is Strong Down.
Momentum : Price is neither overbought nor oversold currently, based on RSI-14 levels (RSI > 30 and RSI < 70).
Support and Resistance : Nearest Support Zone is $0.40, then $0.30. Nearest Resistance Zone is $0.50, then $0.62.

FTMUSDT Will This Bullish Reversal Hold?Yello, Paradisers! Have you been watching #FTMUSDT closely? This analysis could determine your next big move!
💎#FTM is showing promising signs as it bounces off the demand zone, forming a double bottom a classic bullish reversal pattern. However, the key question is: Can FTM break through the descending resistance trendline, which has been rejected it three times already.
💎For FTM to switch back to bullish momentum, it must break through the descending resistance. A successful breakout will likely lead to a significant upward move towards our target strong resistance area.
💎If FTM fails to break the resistance, it may test the demand zone at 0.386 again. This could either create new momentum or form a triple bottom.
💎 If FTM breaks below the demand zone and heads toward the key support area, it would be a concerning sign. The key support at 0.309 is critical; a daily close below this level would invalidate the bullish scenario and suggest a higher probability of further downward movement.
Treat the market as a businessman, not as a gambler.
MyCryptoParadise
iFeel the success🌴

FTM Trade idea for minimum 10% ProfitI entered a buy position at 0.42900, and my stop loss is at 0.42100, I have found my entry from 5 and 15m and we have the possibility of taking out the 4H structure or even higher. As always if I see any suspicious move I will close my trade and update this idea.

FTM Mega Dump IncomingFTM with Sonic narrative is still not making more new user interested
FTM will mega dump if Sonic not beat Solana ecosystem and active user

Fantom Struggling To Hold Support And About To Print Strong BearFantom's daily chart is one of the most bearish at the moment. The token has been in a strong downtrend since March and is about to approach a decisive moment.
Currently, Fantom struggles to hold above a major support level at 0.43. Moreover, the price reaches a corner build of the support level at the long-term downtrend. As a result, it is likely that we will see a breakout soon.
Unfortunately, the probability of a drop is much higher than a break out to the top. Here's why:
FTM is about to print a bearish Tenkan/Kijun crossover. This crossover is about to happen below the Ichimoku cloud — this is considered an even stronger signal. Besides, the price trades below the Ichimoku cloud, and the future cloud predicts a bearish trend. Overall, three aspects that signal a high risk of further drop.
In case of a drop, the next support sits at ~0.35.

Why Fantom Faces The Risk Of A 20% Drop!In this video, I take a look at the Fantom (FTM) chart and discuss the bearish scenario of a 20% drop.
The analysis is based on trend line but especially on the Ichimoku trading system. In particular, I pay attention to a potential bearish cross of the Tenkan and Kijun lines that is about to happen below the Ichimoku cloud.
Tune in and let me know your thoughts!

Now we can look for entry To BUYAs I told you in the previous trade idea we might have a bull move in FTM (I will mention the previous idea link), now we have the confirmation in 4h and can buy with 1h and 15m time frame patterns.
if I could find any entry I will post that too

FTM/USDT - Futures We're expecting a clean liquidity grab to the downside.
Then we'll be in business. You can take TP 1 at 100%.

papicoin long term strategy for fantom $ftmblessings to all sisters and brothers who search and work for consciousness, love and freedom.
for you who understand what is going on and see on crypto the opportunity to empower decentralized communities for decentralized power and wealth, i am glad to share my long term strategy on theses cryptos that I am willing to accumulate and hodl.
the green areas are the ones I will use to but and accumulate, the lower the prices the more amount of capital, of course.
in the blue areas I will be taking some profits, the higher the price the more I will distribute.
feel free to ask anything, i would be glad to answer, but I do not promise immediate responses, lol.
keep connecting to the vibrations and elevating the frecuencies for the human awakening by meditating, praying, celebrating and being the origin of love and harmony!

Just recovering | Short BiasOn 4H TF
FTM is pulling back to Golden Ratio that is also the confluence for resistance
I expect BINANCE:FTMUSDT will hit and reject this zone
Can trade on lower timeframes
Time will tell


VERY BULLISH ON FTM. Do Not Miss!High Time Frame POC tapped, Weekly level tapped, previous daily high broken, RSI Oversold, Double bottom pattern, high volume node above (Target) 22% away.
Chart looks bullish long term.
Calculate Your Risk/Reward so you don't lose more than 1% of your account per trade.
Every day the charts provide new information. You have to adjust or get REKT.
Love it or hate it, hit that thumbs up and share your thoughts below!
This is not financial advice. This is for educational purposes only.


We may have started a possible bull run but chances are LOWA new 4H structure is created and broken, and we may start another bull leg, I have my possible moves prediction for FTM, and this is the continuation of the Idea that I marked previously in a few posts earlier ( I will link the related idea) and I have sorted them by the possibilities from 1-to-5 and the 1 is the most possible move in my opinion because it can trap many traders.

FTM (Fantom): Approaching SupportTrade setup : Price remains in a downtrend. It had a failed breakout from Falling Wedge pattern and failed to stay above $0.50 resistance, which would signal trend reversal. If it breaks back above $0.50, it could revisit $0.60 for a +20% gain.
Pattern : Price is Approaching Support , which is a level where it could pause or reverse its recent decline, at least temporarily. Support is often a level where price has bounced up in the past, or potentially prior Resistance level that was broken. (concept known as polarity). Once price breaks below support, it can move lower to the next support level. Learn to trade key levels in Lesson 7.
Trend : Short-term trend is Strong Down, Medium-term trend is Strong Down and Long-term trend is Strong Down.
Momentum is Bullish but inflecting. MACD Line is still above MACD Signal Line but momentum may have peaked since MACD Histogram bars are declining, which suggests that momentum could be nearing a downswing. Price is neither overbought nor oversold currently, based on RSI-14 levels (RSI > 30 and RSI < 70).
Support and Resistance : Nearest Support Zone is $0.40, then $0.30. Nearest Resistance Zone is $0.50, then $0.62.

Fantom FTM Still in "Mega Downtrend" or something "Mini Rug"FTM with Sonic (just only) narative wont affect the market up, and now Fantom team gaining exposure with "Meme" (trash) contest when in outside market "Meme" also crash.
Fantom will more rug in Aug till Sept

FTMUSDT.PFTMUSDT.P is in bearish trend.
Bullish divergence form in RSI.
We wait for further confirmation.
We wait for the breakout of last LH>

Trade Setup: FTM Long PositionMarket Context:
FTM has retraced down to the next area of support, presenting an opportunity to enter a long trade. The price might consolidate in this support area over the next couple of days.
Trade Parameters:
Entry: Ladder into a long trade in the $0.45 - $0.49 area of support.
Take Profit:
First target: $0.60 - $0.65
Second target: $0.73 - $0.80
Stop Loss: Set just below $0.40
📊 Monitor the price action for consolidation and signs of support holding before entering the trade. Adjust the setup as needed based on market dynamics to optimize the trade. #FTM #CryptoTrading #TradeSetup 🎯

This is how i plan to exit my PositionI had a buy position previously and the result was stop loss because I traded spot I wanted to sell them at less loss and this is my plan for selling

Possible bull structureAs I said in my previous post I entered with a lot of FOMO and If I had waited I could have entered at much better and lower prices
but because I want to share the real side of trading I show the exact price that I entered and I will continue this process
as always I have my possible moves for both sides of market and my stop loss is there but this time even if I hit stop loss again I will wait to see the entry and I try not to get affected BY FOMO!!!! ;)
