Breaking: Fantom ($FTM) Faces Turbulence Amid Coinbase DelistingOverview
Fantom ( UPCOM:FTM ), a popular blockchain platform known for its speed and scalability, is under the spotlight following Coinbase’s decision to suspend its trading. This move, effective January 24, 2025, has sent ripples through the market, sparking fears of a potential price dip to $0.50. Despite this looming challenge, UPCOM:FTM has shown short-term resilience, with a slight uptick in its price. However, technical indicators suggest a bearish trajectory, warranting close observation from traders and investors alike.
The Delisting Announcement
Coinbase, one of the leading crypto exchanges, announced the suspension of UPCOM:FTM -PERP trading across its platforms, including Coinbase International Exchange and Coinbase Advance. The final settlement price will be calculated based on the average index price 60 minutes before trading ceases. Open positions will be automatically settled at the time of suspension, with funding rates set to zero for the final funding period.
This announcement coincides with the ongoing scrutiny of Coinbase by the US Commodity Futures Trading Commission (CFTC) in connection to the Polymarket investigation. The regulatory body has issued a subpoena to Coinbase, seeking customer-related information, further adding to the uncertainty surrounding $FTM.
Current Market Performance
Despite the negative sentiment, UPCOM:FTM ’s price has risen by 5.38% in the last 24 hours, reaching $0.6953. However, the token remains down by 11.80% over the past week and 41.62% over the past month. With a 24-hour trading volume increase of 0.35% and market cap growth of 6.56%, UPCOM:FTM appears to be attempting a recovery from its recent losses.
Nevertheless, bearish sentiments dominate, as evidenced by a volatility rate of 22.52%. The market’s response to the delisting announcement and regulatory developments will likely dictate the token’s short-term trajectory.
Upcoming Developments: Sonic Rebranding
In a bid to counter negative market sentiment, Fantom is undergoing a rebranding initiative. On January 13, 2025, UPCOM:FTM will transition to a new identity, “Sonic,” with a 1:1 token swap ratio. Binance, a major supporter of this transition, will enable deposits for Sonic on January 16, 2025, and open trading pairs shortly thereafter. This rebranding could provide a fresh narrative for the project, potentially mitigating some of the damage from the delisting.
Technical Analysis
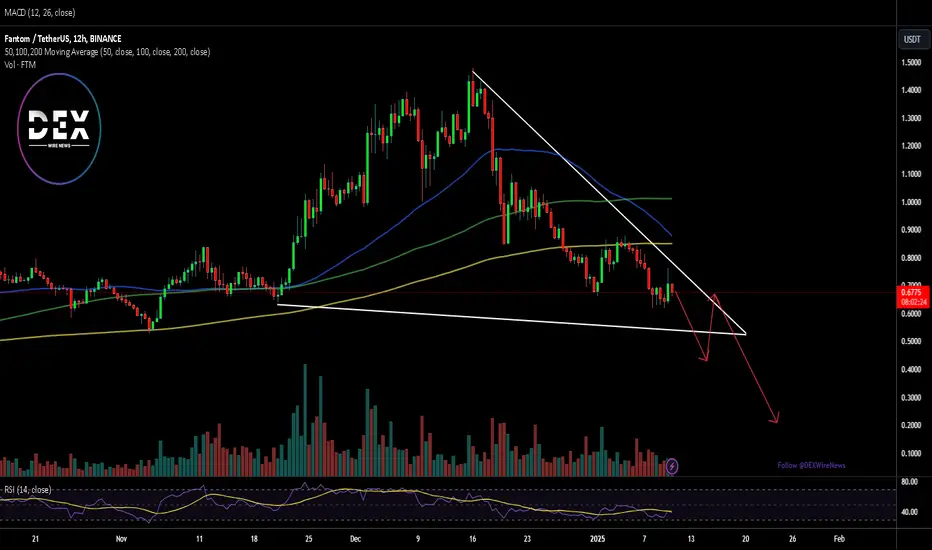
As of this writing, UPCOM:FTM ’s RSI stands at 39, indicating weak momentum and oversold conditions. The token’s chart reveals a falling wedge or bearish symmetrical triangle pattern, signaling a potential downward breakout. A close below the current candlestick could trigger a selling spree, with UPCOM:FTM potentially testing the $0.50 support level.
Fundamental Concerns
1. Regulatory Pressure: The CFTC’s investigation into Coinbase adds an additional layer of uncertainty, impacting both the exchange and tokens like UPCOM:FTM listed on it.
2. Market Sentiment: The delisting has raised questions about UPCOM:FTM ’s future accessibility and liquidity, contributing to bearish market sentiment.
3. Rebranding Efforts: While the Sonic rebranding initiative is a positive development, its success will depend on market reception and execution.
Conclusion
Fantom ( UPCOM:FTM ) faces significant challenges following Coinbase’s delisting announcement and ongoing regulatory scrutiny. While the token’s short-term resilience is commendable, technical indicators and market sentiment suggest a bearish outlook. The upcoming rebranding to Sonic offers a glimmer of hope, but traders should remain cautious and monitor key support levels.
FTMUSDT trade ideas

ftmusdt-1hFantom has a bullish divergence on RSI in this zone and also has reversal potential from here....
if you want to buy manage your positions and be careful...
its not a financial advice...

FANTOM MIGRATIONfantom is migrating to Sonic,
Selling pressure and closing futures contracts will cause a sharp decline in price,
We are seeing a inverted Cup and Handle pattern,
not financial advice.

FTM we are down to 0.531! Shoulders and Head Formation!Beautiful head and beautiful shoulders!!! This formation was recently reversed and threw us from 0.5182 to 0.7652. If we go a similar route now, we will fall to 0.531 or even lower by 32%,
to 0.45, but with a very bad situation of Bitcoin.

FTM 1DHello, as you can see, the situation of Fantom is very bad and the important support that started from the bottom of 25 cents is breaking. I expect a drop until January 16th until it is listed again on all exchanges.
In any case, if we go below 66 or 65 cents, we can reach 35 or even 33 cents.
My personal opinion is a bearish scenario. I don't have much hope for price growth.

Long Opportinity for FTMClearly rejected from EMA200, while the overal daily diretion is bullish. Every step it goes down, better opertunity for entry.

FTM Short Entry on 1 Hour TimeframeFTM on a higher timeframe it is in accumulation phase. Market is in process of loading their orders to long on a 1 Day time frame. But now there is short entry on 1 hour time frame where price end his disruption phase and going to the cycle of 1 day Accumulation phase.

FTM 1D Dynamic Liquidity Zone Setup - liq sweep longPrice is sitting just above the Point of Control (POC) within the highlighted Dynamic Liquidity Zone.
VAL (The Value Area Low) of this zone is marked around $0.6530, which aligns with a potential key buy zone, being our first midrange high.
RSI is trending bearish but nearing oversold levels, suggesting that a liquidity sweep into the $0.65–$0.70 zone could trigger buy orders.
Wait for Price to Sweep VAL ($0.65):
If price dips into the $0.65 liquidity zone, it is a high-probability area for accumulation before a reversal.
Look for divergence in RSI or an oversold condition (<30 RSI) as additional confluence.
Dynamic Liquidity Zone:
The POC (~$0.71) and VAH (Value Area High) near $1.09 form key dynamic resistance. Price could oscillate in this range before confirming breakout direction.
Entry: DCA starting w VERY small size at POC (less than 10%) , up to VAL (up to less than 35% of the amount), fib 0.786 the rest and more.
Targets:
$0.85 (VAH) for short-term profit-taking.
$1.00–$1.10 for extended targets if bullish momentum builds.
Stop Loss:
Below $0.47
Low Leverage, Higher size.

FTM/USDT: Wave Pattern Signals Potential 80% Upside | Key Levels
Technical Analysis:
1. Price is currently at $0.7892, down 4.63%
2. Wave structure suggests completion of ABC correction at point (C)
3. Fibonacci retracement level at 0.786 aligns with potential reversal zone
4. Two target zones identified:
- First target: ~$1.20-1.30 (Wave 3)
- Second target: ~$1.30-1.50 (Wave 5)
Trading Setup:
- Entry zone: $0.75-0.78
- Stop loss: Below point (C) around $0.70
- Risk:reward ratio approximately 1:3 for first target
Key Points:
- Bullish divergence forming at current levels
- Price testing ascending trendline support
- Wave structure suggests start of new impulsive wave up
Caution:
- Wait for confirmation of reversal with price action
- Consider position sizing due to crypto market volatility
- Monitor BTC correlation for trade validation

#FTM/USDT Ready to go higher#FTM
The price is moving in a descending channel on the 1-hour frame and sticking to it well
We have a bounce from the lower limit of the descending channel, this support is at 0.7824
We have a downtrend on the RSI indicator that is about to be broken, which supports the rise
We have a trend to stabilize above the moving average 100
Entry price 0.7826
First target 0.8170
Second target 0.8634
Third target 0.9046

#FTM/USDT Ready to go higher#FTM
The price is moving in a descending channel on the 1-hour frame and sticking to it well
We have a bounce from the lower limit of the descending channel, this support is at 0.6900
We have a downtrend on the RSI indicator that is about to be broken, which supports the rise
We have a trend to stabilize above the moving average 100
Entry price 0.7300
First target 0.7735
Second target 0.8078
Third target 0.2490


FTM/USDT Bulish and Correction As you can see, All targets of my last Idea about bearish FTMUSDT is touched and right now it is possible to touch these prices less than 2 weeks.
Previous IDEA:


FTM: The prospect of increasing?BINANCE:FTMUSDT
As you can see, FTM has created an ascending head and shoulders and is also located in the megaphone, which means that if it breaks, we expect the price to reach the target (AB=CD).
✨Traders, if you liked this idea or have your opinion on it, write in the comments, We will be glad.
_ _ _ _ __ _ _ _ _ _ _ _ _ _ _ _ _ _ _ _ _ _ _ _ _ _ _ _ _ _ _ _
✅Thank you, and for more ideas, hit ❤️Like❤️ and 🌟Follow🌟!
⚠️Things can change...
The markets are always changing and even with all these signals, the market changes tend to be strong and fast!

FANTOM bullish structure #FTM has a bullish structure as you can see there's an M harmonic pattern in the market which can make it rise also demand zones made us 4 entry points ! Don't lose it !

consolidation under resistance for FTM after HTF reversalrecovery of uptrend has been strong and FTM is now consolidating right below prior support. since it has not rejected when touched it, but rather consolidated, we can expect a strong onward continuation upward

FTM LongFTM can maybe go up 50% in 8 - 14 days if BTC dont crash. We are uptrending so the valuegap should be filled, TP at your own desire in the value gap.


shrtilla godzilla Look at rake long - shorts = 2,21 , that mean all of shorts going to get out by stop losess soon , and we take a huge candle i would say to bottom of last vawe VWAP 0,78
and we already got a CVD decreasing , otgether with TOTAL descending

FTM/USDT - Consolidation Zone Analysis: Breakout Incoming?Summary
Fantom (FTM/USDT) is trading within a consolidation range between $0.6639 (support) and $1.0559 (resistance). Technical indicators suggest the potential for a significant breakout in either direction. Here's a detailed probability-based analysis of what might happen next.
Key Insights
Current Price Action:
FTM is consolidating near the mid-zone of its range.
Current price sits around $0.83, closer to support than resistance, indicating cautious sentiment.
Support and Resistance:
Support: $0.6639 – A strong demand zone tested multiple times.
Resistance: $1.0559 – A key psychological and technical barrier.
Technical Indicators:
MACD: Shows bearish momentum, but signs of narrowing suggest potential for reversal.
Stochastic RSI: Near overbought levels (~0.8078), cautioning against overextension.
ADX: At 45.53, indicating a strong prevailing trend, currently bearish.
Breakout Probabilities:
Bearish Breakdown (Below $0.6639): ~65%
Strong bearish momentum backed by directional indicators.
Downside targets could include $0.55 or lower.
Bullish Breakout (Above $1.0559): ~35%
Requires reversal in momentum and increased volume.
Upside targets could reach $1.20 or more.
Conclusion:
FTM is currently in a consolidation phase, with bearish probabilities outweighing bullish ones.
Traders should monitor:
A breakout above $1.0559 for a bullish confirmation, targeting $1.20 or higher.
A breakdown below $0.6639 for a bearish continuation, with potential to test $0.55 or lower.
Risk Management: Consolidation zones often precede high volatility. Ensure stops are placed strategically and manage exposure based on risk tolerance.
