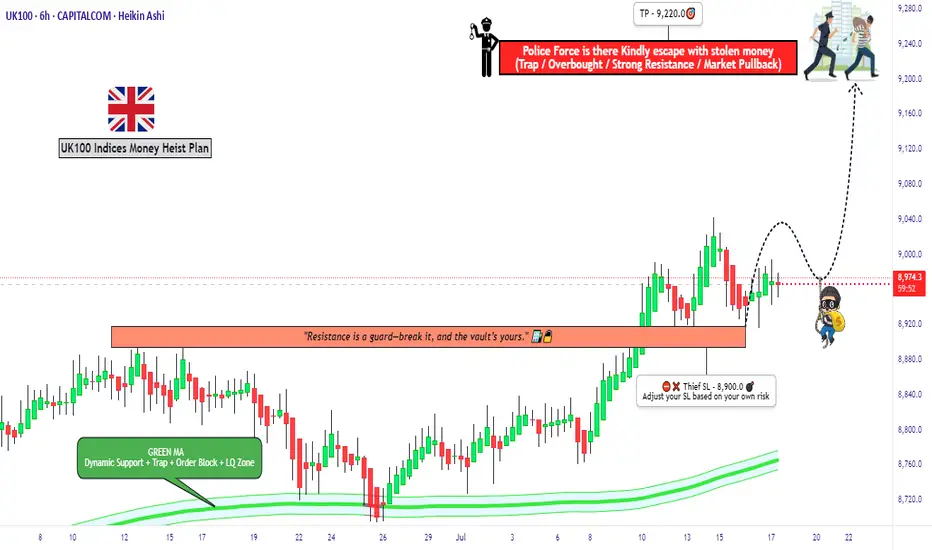
"UK100 Bulls Vault Open! Grab the Loot & Escape Early"🏴☠️💰"UK100 / FTSE100 Market Heist Blueprint" – A Thief Trading Operation for High-Profit Target Extraction 💼📈
🌍 Hola! Hi! Bonjour! Ola! Hallo! Marhaba!
To all the Market Robbers, Smart Thieves, and Strategic Money Makers — welcome to another Thief Trading Heist Plan™.
Ready your gear and charts —
About FTSE 100 Index
The UK Financial Times Stock Exchange 100 is an index of share prices of the largest 100 companies listed on the London Stock Exchange (LSE) by market capitalisation. The index was launched on January 3, 1984 at a base value of 1000, and the index level is calculated in real-time.
Related indices
uk100 crazy pump - time to SHORTTeam, those who SHORT UK100, make sure stop loss at 9175
Target 1 at 9135-32
Target 2 at 9109-16
Last few months, UK100 has been aggressively cutting rate due to expose in recession. But now they are out of the wood.
The market has been over pricing and over value.
We expect the market to come

UK100 short - head and shoulders H4Risk/ reward = 4.6
Entry = 8 998.5
Stop loss = 9 034.2
Take profit level 1 = 8 859.8
Take profit level 2 = 8 794
Still need confirmation,
Waiting for H4 candle to close at 23.00 and will need to validate volume.

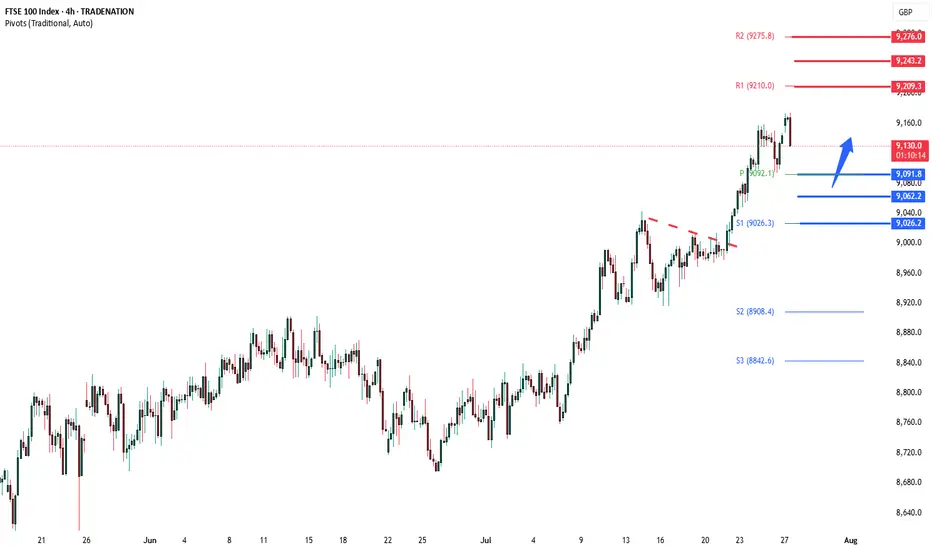
FTSE corrective pullback support at 9092The FTSE remains in a bullish trend, with recent price action showing signs of a corrective pullback within the broader uptrend.
Support Zone: 9092 – a key level from previous consolidation. Price is currently testing or approaching this level.
A bullish rebound from 9092 would confirm ongoing ups
BOOM📈 What If You Built a Position Here?
FTSE100. March–April lows.
Three consecutive BUY signals from ELFIEDT RSI + Reversion.
Each one stacking confidence.
Each one building conviction.
Each one right before the entire market exploded higher.
And it wasn’t just FTSE…
🟢 US500? Triggered.
🟢 DOW? Trig

Another one?📉 The Drop Looked Scary… But This Indicator Saw the Opportunity.
FTSE100 plunged. Traders panicked.
But our ELFIEDT RSI + Reversion script printed BUY — right at the bottom.
🟢 The Entry? Simple:
✅ RSI dipped far below its comfort zone
✅ Candle tagged our reversion level
✅ Buy signal confirmed in

FTSE rally resistance at 9150The FTSE remains in a bullish trend, with recent price action showing signs of a corrective pullback within the broader uptrend.
Support Zone: 9045 – a key level from previous consolidation. Price is currently testing or approaching this level.
A bullish rebound from 9045 would confirm ongoing ups

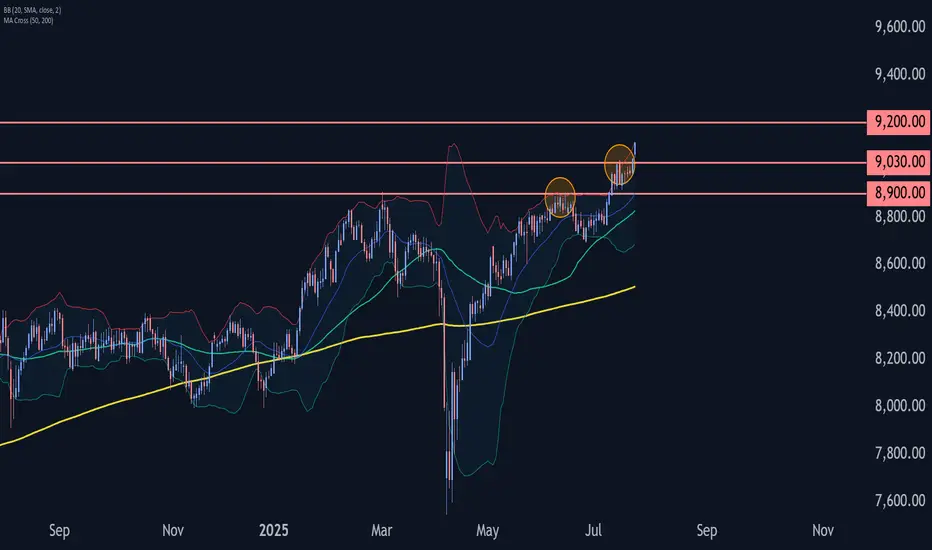
FTSE 100 Wave Analysis – 23 July 2025- FTSE 100 broke resistance level 9030.00
- Likely to rise to resistance level 9200.00
FTSE 100 Index recently broke above the resistance level 9030.00, which stopped the previous minor impulse wave 1 at the start of July.
The breakout of the resistance level 9030.00 continues the active minor imp
FTSE100 breakout zone now new support at 9030The FTSE remains in a bullish trend, with recent price action showing signs of a continuation breakout within the broader uptrend.
Support Zone: 9030 – a key level from previous consolidation. Price is currently testing or approaching this level.
A bullish rebound from 9030 would confirm ongoing u

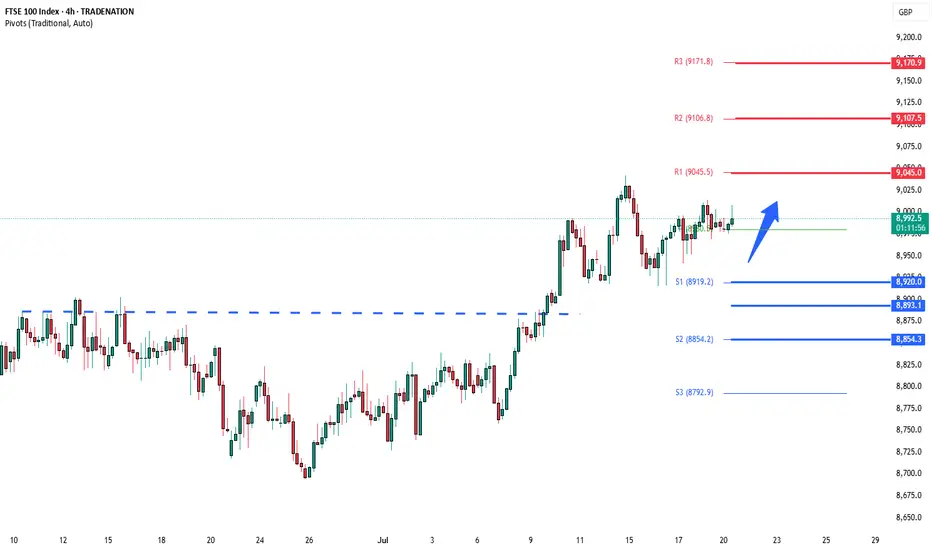
FTSE bullish consolidation resistance at 9045The FTSE remains in a bullish trend, with recent price action showing signs of a corrective pullback within the broader uptrend.
Support Zone: 8020 – a key level from previous consolidation. Price is currently testing or approaching this level.
A bullish rebound from 8920 would confirm ongoing ups
See all ideas
Summarizing what the indicators are suggesting.
Oscillators
Neutral
SellBuy
Strong sellStrong buy
Strong sellSellNeutralBuyStrong buy
Oscillators
Neutral
SellBuy
Strong sellStrong buy
Strong sellSellNeutralBuyStrong buy
Summary
Neutral
SellBuy
Strong sellStrong buy
Strong sellSellNeutralBuyStrong buy
Summary
Neutral
SellBuy
Strong sellStrong buy
Strong sellSellNeutralBuyStrong buy
Summary
Neutral
SellBuy
Strong sellStrong buy
Strong sellSellNeutralBuyStrong buy
Moving Averages
Neutral
SellBuy
Strong sellStrong buy
Strong sellSellNeutralBuyStrong buy
Moving Averages
Neutral
SellBuy
Strong sellStrong buy
Strong sellSellNeutralBuyStrong buy
Displays a symbol's price movements over previous years to identify recurring trends.
Frequently Asked Questions
The current value of FTSE 100 Index is 9,105.15 GBP — it has fallen by −0.20% in the past 24 hours. Track the index more closely on the FTSE 100 Index chart.
FTSE 100 Index reached its highest quote on Jul 24, 2025 — 9,158.21 GBP. See more data on the FTSE 100 Index chart.
The lowest ever quote of FTSE 100 Index is 1,717.70 GBP. It was reached on Sep 9, 1988. See more data on the FTSE 100 Index chart.
FTSE 100 Index value has increased by 1.65% in the past week, since last month it has shown a 4.13% increase, and over the year it's increased by 11.22%. Keep track of all changes on the FTSE 100 Index chart.
The champion of FTSE 100 Index is LSE:CCEP — it's gained 10.93 K% over the year.
The weakest component of FTSE 100 Index is LSE:WPP — it's lost −41.26% over the year.
FTSE 100 Index is just a number that lets you track performance of the instruments comprising the index, so you can't invest in it directly. But you can buy FTSE 100 Index futures or funds or invest in its components.
The FTSE 100 Index is comprised of 100 instruments including LSE:AZN, LSE:HSBA, LSE:SHEL and others. See the full list of FTSE 100 Index components to find more opportunities.