Higher USD and Yields will push equties downOnly low Inflation, BNM easing and Big Spending can push Equities higher again
FBMKLCI trade ideas

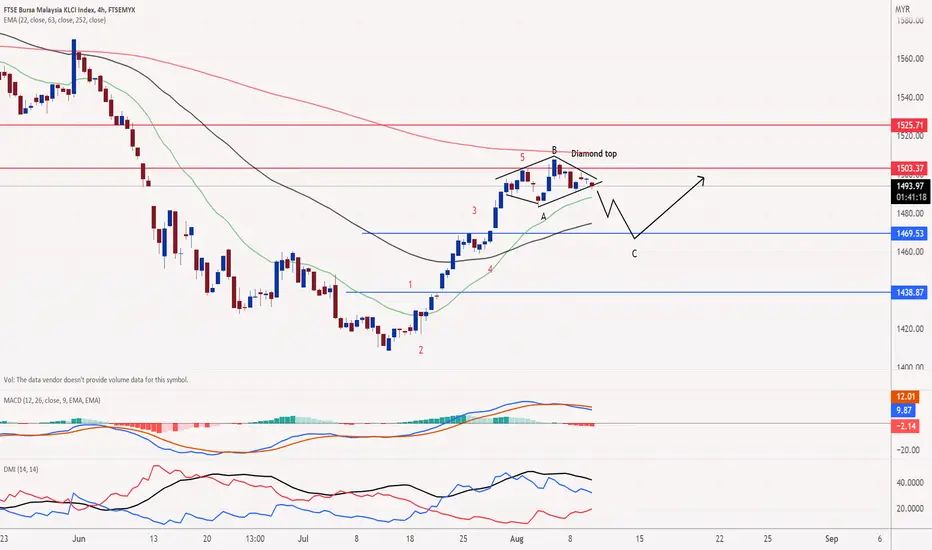
KLCI - Sub-impulse wave ended, Potential buy at 1,469KLCI has completed its minor 5-wave move and as the diamond top has formed, it hinted a potential reversal. Furthermore, the corrective expanded flat is forming, with 1469 being 161.8% extension of the diamond top.
KLCI & TOPGLOV: Pure speculationPure speculation for fun. Don't make important decisions based on this.
Gloves tend to lead KLCI recovery after a crash.
SPX mid-term seasonality likely sideways at best before Q4 or with a bottom in September before rising towards mid-term elections in November.
If KLCI were to "crash" and follow this pattern, it will start in August and bottom in September/October.

My Prediction KLCI Will Drop to 1230-1250 pointsMonthly Time Frame
My forecast for long term move on Monthly TF, our KLCI will continue downtrend to complete correction wave at around 1237 points as long as price didn't break previous extreme high at 1900. I forecast that Correction will be in triangle pattern and at the same time will complete sub wave 4 then will make a drop to fibo 0.382 at 1237 point to complete sub Wave 5 and wave C. If let say the price terminate at fibo 0.382 ( end of Cycle wave 4) then I can say a bullish ahead to start of Cycle Wave 5 I hope my prediction will go wrong and KLCI will be in uptrend very soon.

Bounce from 200 Monthly Moving AverageWith Fiscal Stimlus then could bounce then December January decide direction. FDI, exports and foreign funds flows may tilt the bias

FBMKLCI Monthly POVTechnical reasons:
Double Top confirmation
Structure broken
Failed to make series of higher high
Downtrend Continuation
Cup & Handle in the making..
Fundamental reasons:
Inflation
rate hike
rising oil prices
Russia Ukraine conflict

Order in the midst of chaos and complexityMarket Geometry is a fascinating phenomena.
The philosophy and principle behind the Market Geometry is that there is Order, Symmetry, Harmony in the midst of complexity and chaos, as manifested by human behaviors in the market.
This is another illustration of such phenomena using Gann Box to create market geometry.
After creating Gann Box B1 to B4, we can make a projection of possible market behavior in the next time period.
My video course on "Buy Low Sell High" is following the ancient China wisdom with much emphasis on Harmony with the Nature and Universe in the midst of chaos and complexity.

Malaysian economy is tumbling.Malaysia country is getting a hard tumbling economy, due to world recession.
The inflation will bring more pressure for the economy dropping in a few month ahead.
For Malaysian, be wise and careful.. the world recession is coming like after world war 2...


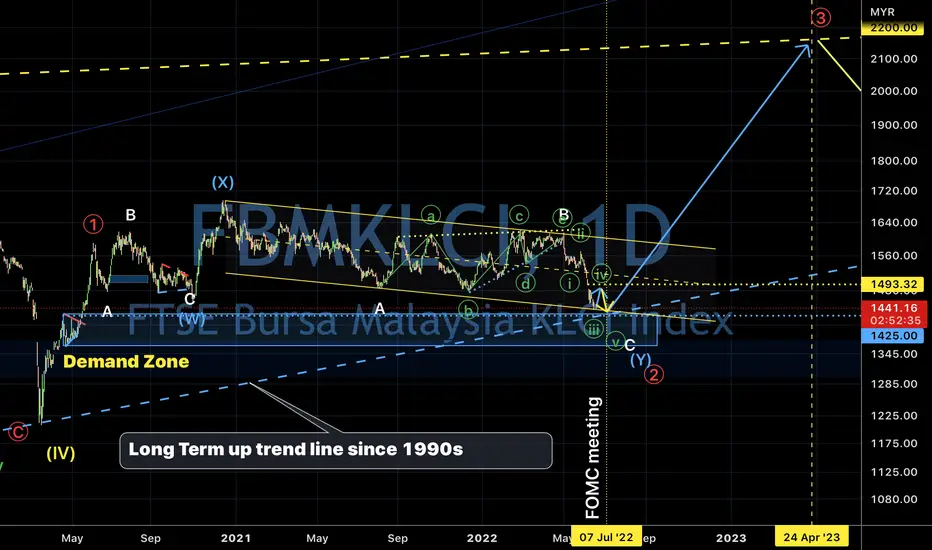
KLCI May only “bottom” at around 1425 on early July. 20/June/22KLCI. Reviewing Fmbklci’s waves structure. Possible forming a complex double three pattern which is (W)(X)(Y)( cyan/ light blue instead of triangle pattern on previous idea.
The Importance of understanding Internal Energy of the MarketMajor world events & KL Composite Index over 44 years.
Major world events such as
Black Monday : Aug-Dec 1987
US Recession : Aug-Sept 1990
Mexican Financial Crisis : Jan 1994-Jan 1995
Asian Financial Crisis : Feb 1997 – Sept 1998
Dotcom Bubble : Feb 2000 – Apr 2001
Sept 11, 2001
SARS : Apr 2002 – Mar 2003
Global Financial Crisis : Jan 2008 – Oct 2008
European Debt Crisis : Jul – Sept 2011 –
Oil Glut : Oct – Dec 2014
COVID : 2020-2022
Ukraine Crisis : 2022
The major world events as shown in vertical blue columns.
What is of significance is that the occurrences of these major world events are in the golden uptrend channel.
What is the implication?
In my video training course "Buy Low Sell High", I explain that market system has its internal strength and weaknesses and its own "healing energy" to make correction to these negative events and still move forward.
It is like our own human system with its built in immune system that is designed to overcome major diseases.
Hence it is important to study and analyze the Internal Energy of the market system and not be derailed by overlly focus on events.

Lines Construction creates order of the chaotic market behaviorThis is Malaysia Kuala Lumpur Composite Index as @17th June, 2022.
The market behavioral patterns are similar to any other market from the Technical Analysis point of view, using Integrated and Holistic Approach.
A market graph looks chaotic but when some meaningful construction lines are made, you can see patterns and trends and make some projection into the future market scenarios.
This market continues to be bearish with consolidation. The market will likely move to the moving average of the Bollinger Band.
The MACD histogram needs to complete its negative sine wave.
And the Stochastic will be in oversold region for some time to come.
12th July will be an interesting timing to notice how complete is the consolidation.

KLCI. Finding its “Yin & Yang” forces. 15/June/22KLCI index currently “reside” @ around the “terminal/ center of gravity “ of universal Yin ( seller’s force) and Yang ( buyer’s force”..What do you “see first?” Or “think second?”....

FBMKLCI - Expecting a Rebound Rebound condition :
1) FundFlow+ indicator - Bull signal appears today, it signal a rebound/reversal thereafter
Support & Resistance:
S : 1535.89
R : 1610.15 to 1614.07
DISCLAIMER:
This script indicator is solely for the purpose of education / opinion sharing only, and should not be construed as investment advice or recommendations to buy or sell any security.
Get your trade advise from a legit broker, you are responsible on your own trade.
Thank you.

Inflation is comingLooking at the long term chart, we will be facing one of a greatest inflation. In my opinion, price will be heading towards the 1100-1050 area in the next 5-6 years. Capital growth investment might be challenging to some, focus more on dividend dividend earning.

FBMKLCI doesn't look goodLooking at the daily and weekly chart,
it can't go further up and break the previous resistant, it stop at fibo 0.382 and weekly chart MA200 line.
Expecting it KLCI will follow global trend on a correction mode.
Support 1 is at 1548
Support 2 is at 1500

RANGING PHASEPrice could push higher in the area of the resistance level. As of now, the market remains hesitant due to a lack of massive movement to break the ranging phase.

KLCI Index Bullish After CorrectionKlci Index Breaout from Head & Shoulder and progressing a correction for Bullish impulse.

Critical ResistanceFBMKLCI is currently located at critical resistance which has been tested multiple times. As the global market being good recently, we do believe the bursa market will come through a super bull run in the recent future. If broken down the trend line will easily drop to 1480.

FBMKLCI - Looking forward a correctionRetracement condition :
1) FundFlow+ indicator - Bear signal is out when FBMKLCI reached its top at the resistance between 1614.07-1610.15.
Support & Resistance:
S : trendline (a)
R : 1614.07 to 1610.15
DISCLAIMER:
This script indicator is solely for the purpose of education / opinion sharing only, and should not be construed as investment advice or recommendations to buy or sell any security.
Get your trade advise from a legit broker, you are responsible on your own trade.
Thank you.

KLCI HUGE SELL OFF!As previously forecasted, price may fall as a result of decreasing buyer demand. Price is currently in a channel up movement and if it can hold 1575 - 1580, it may retest 1600 (short term recovery). However, if the price falls below 1575, there's a high possibility it will plummet to 1557 area.

RISING WEDGE (BUYER WEAKENING)Buyer slowing down to push the price higher as it is in the supply area that haven’t be broken previously. To expect price will move lower for the next few weeks ahead.

FBMKLCI Analysis(28 MARCH 2022)-A lot of price action visible when lowering the timeframe.
-Compression is a signal for upcoming bearish.
-Maybe the price will make a fakeout at the supply zone.
Sorry my english bad.Have a nice day and stay safe everyone!
Disclaimers:-
I AM NOT A FINANCIAL ADVISOR,EVERYTHING I SHARE IS JUST MY OPINION.
