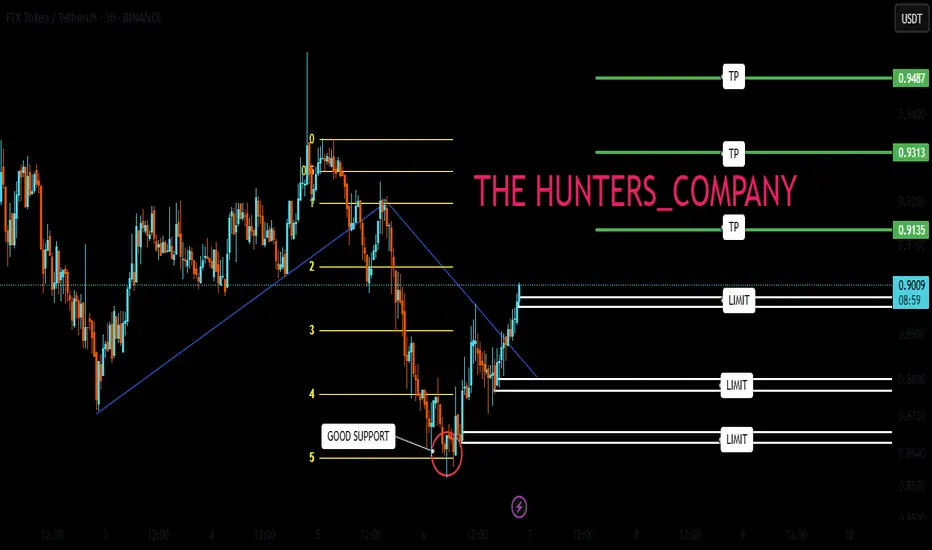
FTT : Go to work, it's goodHello friends🙌
✅after the decline we had, you can see that the price was supported by buyers in the support area we identified with Fibonacci and broke its resistance.
✅Now you can buy in the support areas we have identified for you with risk and capital management and move towards the set goals.
Related pairs
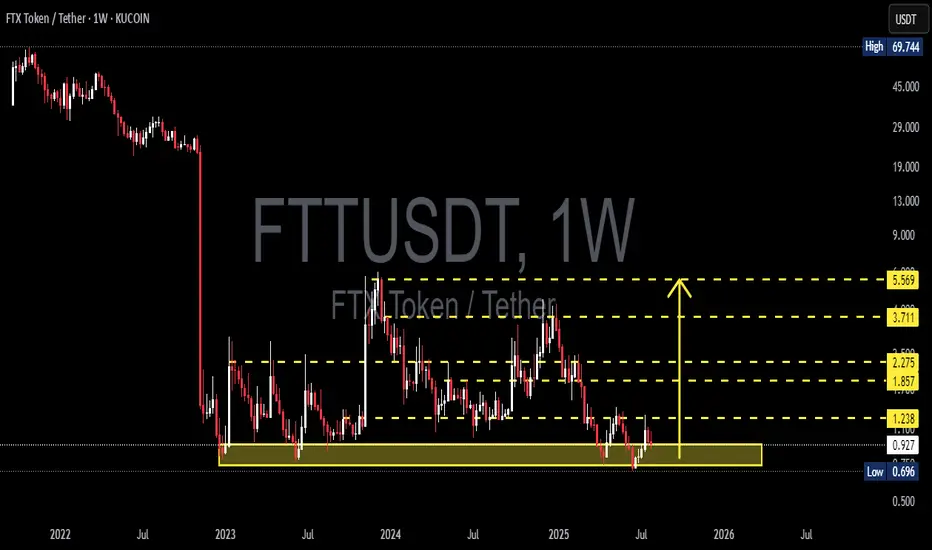
FTTUSDT at the Edge! Breakdown or Massive Breakout?📌 Overview: A Rebirth from the Dead Zone
FTT/USDT is currently in one of its most technically compelling phases in the past two years. After suffering a catastrophic 98% crash following the collapse of the FTX ecosystem in 2022, price action now shows signs of long-term accumulation at a historical
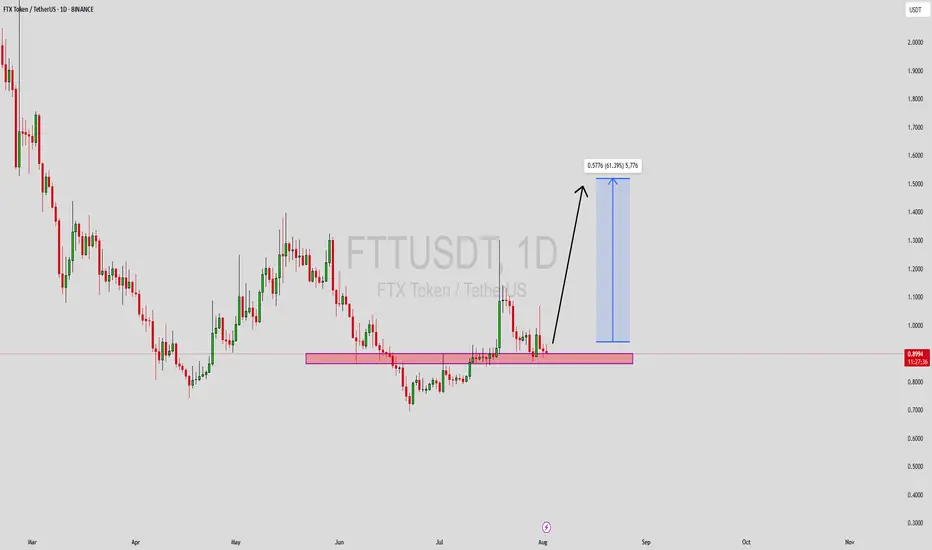
FTTUSDT 1D#FTT has formed a falling wedge pattern on the daily chart.
For a bullish scenario to play out, it must break above the resistance cluster, which includes the wedge resistance, the Ichimoku Cloud, and the daily SMA100, with strong volume.
If that happens, the potential targets are:
🎯 $1.1623
🎯 $1.

FTTFtt usdt daily analysis
Time frame daily
Risk rewards ratio =2.5
Target 1.2
Ftt is not a good asset for hold but I think here is a good place to enter and take a good benefit in short time

FTTUSDT – new accumulation in an interesting zone🚨 This information is intended for thoughtful market participants who are willing to work in this field - not for those chasing gambling, guesswork, or getting stuck in news flow.
Price has returned to the support zone of the outer horizontal channel. Accumulation is currently taking place in this

FTTUSDT Forming Bullish MomentumFTTUSDT is showing renewed strength with a clean breakout setup, supported by good volume and strong technical structure. The current chart reveals a clear horizontal support zone that has been tested multiple times and held firmly, indicating buyers are stepping in with confidence. After the recent
#FTX/USDT Breakout soon#FTX
The price is moving within an ascending channel on the 1-hour frame, adhering well to it, and is on track to break it strongly upwards and retest it.
We have support from the lower boundary of the ascending channel, at 0.8800.
We have a downtrend on the RSI indicator that is about to break a

Is FTT token about to print a 400% move?On the above 5 day chart price action has corrected over 70% throughout 2024. A number of reasons now exist to be bullish. They include:
1) Price action and RSI resistance breakouts.
2) Trend reversal. Notice the higher low?
3) The trend reversal follows strong bullish divergence, which has now co

FTT Breakout soonWaiting for breakout this resistant line
You can buy some after breakout with a short -term target of at least 10%+.

FTTUSDT 1D AnalysisFTT ~ 1D Analysis
#FTT Buy gradually from here if you still have a Conviction on this coin with a short -term target of at least 15%+ from here.

See all ideas
Summarizing what the indicators are suggesting.
Oscillators
Neutral
SellBuy
Strong sellStrong buy
Strong sellSellNeutralBuyStrong buy
Oscillators
Neutral
SellBuy
Strong sellStrong buy
Strong sellSellNeutralBuyStrong buy
Summary
Neutral
SellBuy
Strong sellStrong buy
Strong sellSellNeutralBuyStrong buy
Summary
Neutral
SellBuy
Strong sellStrong buy
Strong sellSellNeutralBuyStrong buy
Summary
Neutral
SellBuy
Strong sellStrong buy
Strong sellSellNeutralBuyStrong buy
Moving Averages
Neutral
SellBuy
Strong sellStrong buy
Strong sellSellNeutralBuyStrong buy
Moving Averages
Neutral
SellBuy
Strong sellStrong buy
Strong sellSellNeutralBuyStrong buy
Displays a symbol's price movements over previous years to identify recurring trends.
Frequently Asked Questions
The current price of FTX Token / TetherUS (FTT) is 0.9990 USDT — it has risen 4.53% in the past 24 hours. Try placing this info into the context by checking out what coins are also gaining and losing at the moment and seeing FTT price chart.
FTX Token / TetherUS price has risen by 14.50% over the last week, its month performance shows a 12.90% increase, and as for the last year, FTX Token / TetherUS has decreased by −22.68%. See more dynamics on FTT price chart.
Keep track of coins' changes with our Crypto Coins Heatmap.
Keep track of coins' changes with our Crypto Coins Heatmap.
FTX Token / TetherUS (FTT) reached its highest price on Sep 9, 2021 — it amounted to 85.7400 USDT. Find more insights on the FTT price chart.
See the list of crypto gainers and choose what best fits your strategy.
See the list of crypto gainers and choose what best fits your strategy.
FTX Token / TetherUS (FTT) reached the lowest price of 0.5000 USDT on Feb 19, 2020. View more FTX Token / TetherUS dynamics on the price chart.
See the list of crypto losers to find unexpected opportunities.
See the list of crypto losers to find unexpected opportunities.
The safest choice when buying FTT is to go to a well-known crypto exchange. Some of the popular names are Binance, Coinbase, Kraken. But you'll have to find a reliable broker and create an account first. You can trade FTT right from TradingView charts — just choose a broker and connect to your account.
Crypto markets are famous for their volatility, so one should study all the available stats before adding crypto assets to their portfolio. Very often it's technical analysis that comes in handy. We prepared technical ratings for FTX Token / TetherUS (FTT): today its technical analysis shows the buy signal, and according to the 1 week rating FTT shows the sell signal. And you'd better dig deeper and study 1 month rating too — it's sell. Find inspiration in FTX Token / TetherUS trading ideas and keep track of what's moving crypto markets with our crypto news feed.
FTX Token / TetherUS (FTT) is just as reliable as any other crypto asset — this corner of the world market is highly volatile. Today, for instance, FTX Token / TetherUS is estimated as 11.38% volatile. The only thing it means is that you must prepare and examine all available information before making a decision. And if you're not sure about FTX Token / TetherUS, you can find more inspiration in our curated watchlists.
You can discuss FTX Token / TetherUS (FTT) with other users in our public chats, Minds or in the comments to Ideas.