FTTUSDT 1D#FTT has formed a falling wedge pattern on the daily chart.
For a bullish scenario to play out, it must break above the resistance cluster, which includes the wedge resistance, the Ichimoku Cloud, and the daily SMA100, with strong volume.
If that happens, the potential targets are:
🎯 $1.1623
🎯 $1.4424
🎯 $1.6475
🎯 $1.9046
🎯 $2.2782
🎯 $2.6517
⚠️ As always, use a tight stop-loss and apply proper risk management.
FTTUSDT trade ideas

FTTUSDT at the Edge! Breakdown or Massive Breakout?📌 Overview: A Rebirth from the Dead Zone
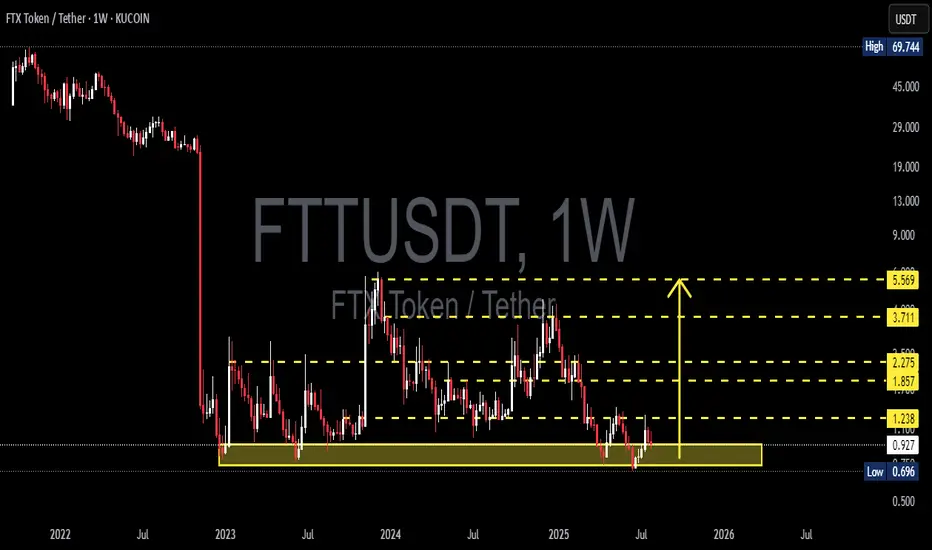
FTT/USDT is currently in one of its most technically compelling phases in the past two years. After suffering a catastrophic 98% crash following the collapse of the FTX ecosystem in 2022, price action now shows signs of long-term accumulation at a historically strong demand zone — potentially forming a solid base for a medium to long-term recovery.
The crucial support zone between $0.70 and $0.90 has been tested multiple times since late 2022 and has consistently held against extreme sell pressure. This suggests the presence of a strong historical demand area. Now that the price is once again reacting bullishly from this zone, the door is opening for a potential technical rebound.
---
🧠 Forming Pattern: Accumulation & Bottoming Structure
1. Base Accumulation Range:
A long period of sideways movement after the major crash.
Indicates exhaustion of selling pressure and possible stealth accumulation by smart money.
2. Potential Double Bottom or Rounded Bottom:
If this rebound holds, a double bottom could be confirmed with a breakout above $1.238.
A rounded bottom formation could signal a major reversal rally if backed by volume and catalysts.
---
🟢 Bullish Scenario (Reversal in Progress):
If buyers hold the current support and push through resistance levels:
🔓 Break above $1.238 = key reversal confirmation.
🚀 Potential bullish targets:
$1.857 – Previous minor resistance.
$2.275 – Former breakout zone.
$3.711 – Key structural level with historical liquidity.
$5.569 – Major psychological and technical target.
Strong confirmation if the breakout is supported by volume and a full-bodied weekly candle.
---
🔴 Bearish Scenario (Further Downside):
If price fails to hold the support zone:
📉 A breakdown below $0.696 would invalidate the bullish setup and could lead to:
New price discovery below $0.50
A potential “death spiral” if sell volume increases rapidly.
This scenario is extreme and would heavily depend on broader market sentiment and the future of the FTX recovery process.
---
🧭 Key Levels & Technical Insights:
Element Details
Strong Demand Zone $0.70 – $0.90 (multi-tested since 2022)
Bullish Trigger Level Break & retest of $1.238 with volume
Reversal Targets $1.857, $2.275, $3.711, and $5.569
Bearish Breakdown Loss of $0.696 = potential for new lows
Early Momentum Current bounce suggests possible start of reversal
---
💡 Final Thoughts:
> "FTT is no longer in a panic phase — it’s in a decision phase: will it rise as a ‘Phoenix Token’ from the ashes of FTX, or fall back into obscurity?"
Given the technical setup and long-term structure, this could be one of the most pivotal moments for FTT. Traders and investors should watch this level closely — the next major move is likely to begin from this very zone.
#FTTUSDT #FTTAnalysis #CryptoReversal #AltcoinWatch #TechnicalAnalysis #SupportResistance #BullishSetup #BearishScenario #DoubleBottom
#FTX/USDT Breakout soon#FTX
The price is moving within an ascending channel on the 1-hour frame, adhering well to it, and is on track to break it strongly upwards and retest it.
We have support from the lower boundary of the ascending channel, at 0.8800.
We have a downtrend on the RSI indicator that is about to break and retest, supporting the upside.
There is a major support area in green at 0.8760, which represents a strong basis for the upside.
Don't forget a simple thing: ease and capital.
When you reach the first target, save some money and then change your stop-loss order to an entry order.
For inquiries, please leave a comment.
We have a trend to hold above the 100 Moving Average.
Entry price: 0.8932
First target: 0.9584
Second target: 1.0267
Third target: 1.105
Don't forget a simple thing: ease and capital.
When you reach your first target, save some money and then change your stop-loss order to an entry order.
For inquiries, please leave a comment.
Thank you.

FTTUSDT – new accumulation in an interesting zone🚨 This information is intended for thoughtful market participants who are willing to work in this field - not for those chasing gambling, guesswork, or getting stuck in news flow.
Price has returned to the support zone of the outer horizontal channel. Accumulation is currently taking place in this area.
📰 FTX is preparing for its third round of distributions - $1.9 billion, expected around September 30. Marked it on the chart. Whether they shift the date or not, the essence remains unchanged.
Possible scenarios:
1️⃣ A double bottom forms in the lower zone of the channel, with a pattern range of about 60%.
👇
- - - - - - - - - - - - - - - - - - - - - - - - - - - - - - - - - - - - - - - - - - - - - - - - -
2️⃣ Another option is a descending wedge, followed by a breakout on volume, a retest of the breakout zone, and further continuation.
👇
- - - - - - - - - - - - - - - - - - - - - - - - - - - - - - - - - - - - - - - - - - - - - - - - -
3️⃣ Next scenario: sideways consolidation within the current zone, with an inner range of 40% and outer range of 90%, followed by a breakout and movement toward the main targets of the larger channel.
👇
- - - - - - - - - - - - - - - - - - - - - - - - - - - - - - - - - - - - - - - - - - - - - - - - -
❗ I marked the downward (protective) zones on the chart that should be taken into account for each of the proposed scenarios — to align with your strategy. This is important. First the plan - then action.
👇
- - - - - - - - - - - - - - - - - - - - - - - - - - - - - - - - - - - - - - - - - - - - - - - - -
📌 P.S. In fact, everything is simpler than it seems.
I believe time is a key factor.
The main thing is to be ready for different scenarios before the final move.
There’s nothing to guess here.
Even if you add another pattern, it won’t change the core idea.

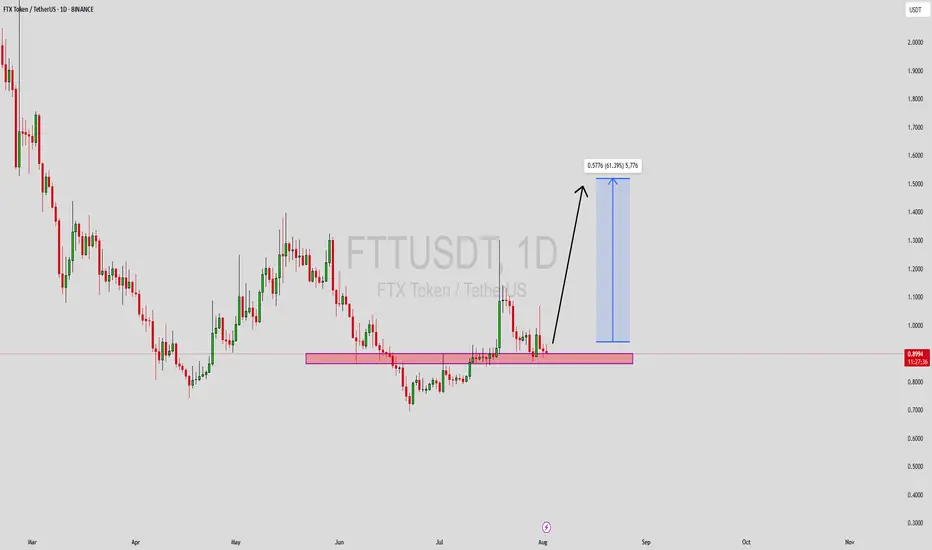
FTTUSDT Forming Bullish MomentumFTTUSDT is showing renewed strength with a clean breakout setup, supported by good volume and strong technical structure. The current chart reveals a clear horizontal support zone that has been tested multiple times and held firmly, indicating buyers are stepping in with confidence. After the recent consolidation, the price appears ready to move higher, potentially offering a 40% to 50% upside in the near term. This setup attracts attention from technical traders looking for confirmation through volume spikes and bullish candlestick formations.
What makes this chart setup even more compelling is the emerging bullish momentum following the reclaim of a key support area. The market has seen a steady accumulation phase, and the subsequent price action shows strength above the highlighted zone, suggesting a possible retest and continuation to the upside. With investor sentiment improving around FTX Token (FTT) and increasing market activity, the possibility of a significant rally becomes more likely, especially if price closes firmly above recent resistance levels.
Investors are taking interest in this project again despite past uncertainties, as the price action begins to signal recovery potential. The projected target from this setup points toward a measured move that aligns well with a 40%+ gain, assuming the broader market remains favorable. It's a promising opportunity for mid-term traders watching for bullish continuations backed by strong volume and sentiment.
If this breakout sustains, FTTUSDT could regain traction as a high-risk, high-reward play. Watching how the price behaves around the current support and near-term resistance will be critical for short-term traders aiming to capitalize on this potential upside.
✅ Show your support by hitting the like button and
✅ Leaving a comment below! (What is You opinion about this Coin)
Your feedback and engagement keep me inspired to share more insightful market analysis with you!
Is FTT token about to print a 400% move?On the above 5 day chart price action has corrected over 70% throughout 2024. A number of reasons now exist to be bullish. They include:
1) Price action and RSI resistance breakouts.
2) Trend reversal. Notice the higher low?
3) The trend reversal follows strong bullish divergence, which has now confirmed.
4) Look left. Notice where the higher low is printing? On past resistance. Excellent.
5) Lastly the bull flag, it has broken out and confirmed support. The flagpole forecasts a 400% move.
Is it possible price action continues to correct? Sure.
Is it probable? No.
Ww

FTT Breakout soonWaiting for breakout this resistant line
You can buy some after breakout with a short -term target of at least 10%+.

FTTUSDT 1D AnalysisFTT ~ 1D Analysis
#FTT Buy gradually from here if you still have a Conviction on this coin with a short -term target of at least 15%+ from here.


FTT - LongThe main target is $1.89, the waiting time is 1-3 months, the asset analysis is kept secret
(Not an investment recommendation)

FTT LONG SETUP ALL trading ideas have entry point + stop loss + take profit + Risk level.
hello Traders, here is the full analysis for this pair, let me know in the comment section below if you have any questions, the entry will be taken only if all rules of the strategies will be satisfied. I suggest you keep this pair on your watchlist and see if the rules of your strategy are satisfied. Please also refer to the Important Risk Notice linked below.
Disclaimer
#FTX/USDT#FTX
The price is moving within a descending channel on the 1-hour frame, adhering well to it, and is heading for a strong breakout and retest.
We are seeing a bounce from the lower boundary of the descending channel, which is support at 1.23.
We have a downtrend on the RSI indicator that is about to be broken and retested, supporting the upward trend.
We are looking for stability above the 100 moving average.
Entry price: 1.29
First target: 1.37
Second target: 1.44
Third target: 1.52

FTTUSDT UPDATEFTTUSDT is a cryptocurrency trading at $1.3195. Its target price is $3.0000, indicating a potential 100%+ gain. The pattern is a Bullish Falling Wedge, a reversal pattern signaling a trend change. This pattern suggests the downward trend may be ending. A breakout from the wedge could lead to a strong upward move. The Bullish Falling Wedge is a positive signal, indicating a potential price surge. Investors are optimistic about FTTUSDT's future performance. The current price may be a buying opportunity. Reaching the target price would result in significant returns. FTTUSDT is poised for a potential breakout and substantial gains.

FTTUSDT 1WFTT ~ 1W Analysis
#FTT Buy gradually from here with a short -term target of at least 20%+.

Breaking: FTT Has to Break This Price Levels to Start A BullrunThe defunct platform native token TSX:FTT has been on a falling wedge lately losing about 50% of value as the long lasting lawsuit against her founders most especially Sam Bankman-fried is showing no signs of ending.
The token has long been oversold with the RSI at 38.45 further solidifying our thesis and in order for TSX:FTT to start a trend reversal to recent highs it has to break through the 78.6 and 38.2% Fibonacci retracements levels respectively in other to pave way for a bullish spree.
In a Recent new, according to a Bloomberg report, the FTX bankruptcy case has cost almost $1 billion in fees, making it one of the costliest bankruptcy cases in America’s history. So far, lawyers have collected around $948 million to work on the Chapter 11 case through January 2. Meanwhile, court records show that the court has approved over $952 million in fees.
This revelation comes following the FTX repayments, which kicked off on February 18. Despite the hefty fees paid for the bankruptcy case, legal experts suggested to Bloomberg that it was worth it, seeing as these lawyers were able to track billions of dollars in digital assets and cash, which the defunct exchange had scattered across several networks of accounts.

FTX Founder Sam Bankman-Fried's Prosecutor QuitsThe cryptocurrency world is once again witnessing the ripple effects of legal drama surrounding FTX, as Danielle Sassoon, the prosecutor responsible for securing Sam Bankman-Fried’s conviction, has resigned. With speculation mounting about the implications for Bankman-Fried’s appeal, the TSX:FTT token is at the center of renewed attention. But does this development signal a fundamental shift for the beleaguered exchange token, or is it merely another headline in FTX’s tumultuous history?
Prosecutor’s Resignation: What Happened?
Danielle Sassoon, a key figure in the prosecution of Sam Bankman-Fried, played a pivotal role in exposing inconsistencies in his testimony, ultimately leading to his conviction. Bankman-Fried was found guilty of fraud, conspiracy, and money laundering, resulting in a 25-year prison sentence.
However, in a surprising turn of events, Sassoon resigned from her role as Acting U.S. Attorney for the Southern District of New York after just three weeks. Reports indicate that her decision stemmed from a disagreement with the U.S. Department of Justice (DOJ) regarding a corruption case against New York City Mayor Eric Adams. In an 8-page resignation letter, Sassoon expressed her unwillingness to comply with a DOJ directive to drop charges against Adams, citing a lack of legal justification for dismissal.
Her departure has ignited speculation within the crypto community. Some believe that a shift in prosecutorial stance could impact Bankman-Fried’s appeal, potentially influencing TSX:FTT ’s trajectory in the market. While such an outcome remains highly speculative, traders are watching closely for any developments that could alter TSX:FTT ’s sentiment.
Market Reactions and Technical Outlook
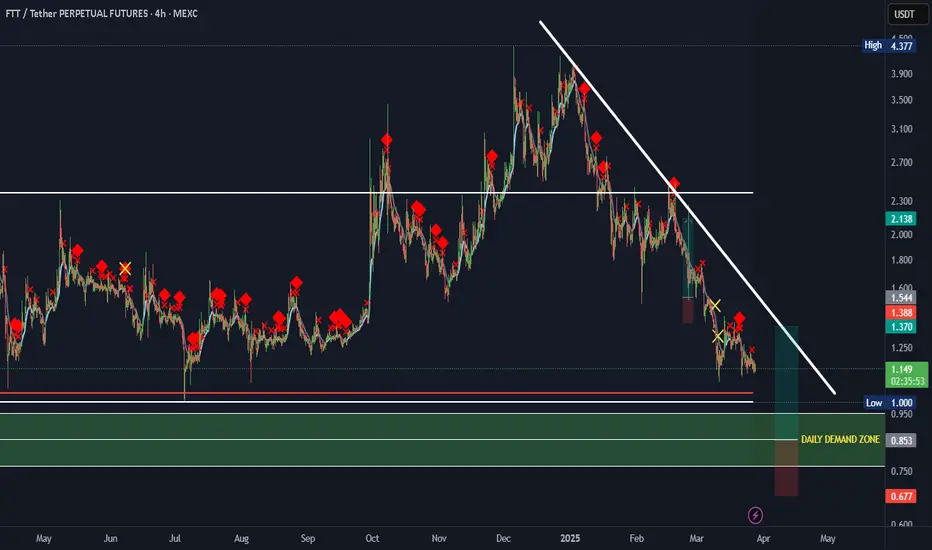
As of writing, TSX:FTT is down 4.27%, consolidating within a bearish zone after surging to nearly $4 in recent weeks. The token has struggled to maintain bullish momentum, with volume appearing weak amid market uncertainty.
Key Technical Indicators:
TSX:FTT remains in a downtrend after failing to hold its recent highs. A lack of significant buying While Sassoon’s resignation might be perceived as positive news for FTX’s former CEO, it remains uncertain whether this will translate into tangible gains for $FTT.
Can TSX:FTT Stage a Comeback?
Despite the legal drama, TSX:FTT ’s long-term outlook remains tied to the broader fate of FTX’s bankruptcy proceedings. The exchange collapsed in November 2022, leaving creditors and users grappling with the fallout. While certain developments, such as potential asset recoveries, could provide some relief, TSX:FTT ’s intrinsic value has been severely diminished due to the exchange’s downfall.
However, some traders see opportunities in TSX:FTT as a speculative asset, banking on volatility-driven short-term price swings.
Conclusion
While Danielle Sassoon’s resignation introduces a new narrative into the FTX saga, its tangible impact on TSX:FTT remains speculative at best. The token continues to trade under bearish conditions, and without a fundamental catalyst, a strong recovery remains unlikely in the near term. However, for short-term traders, volatility surrounding legal developments could present trading opportunities.
As the situation unfolds, investors should remain cautious, keeping an eye on both technical patterns and legal updates that could shape TSX:FTT ’s trajectory in the weeks ahead.

FTTUSDT: Is a Major Breakout Coming? Watch These Key Levels Now!Yello, Paradisers! Is FTTUSDT gearing up for a strong bullish reversal, or is this just another trap? Let’s break it down.
💎FTTUSDT has completed a proper ending diagonal with a clear 5-wave count, signaling a potential trend shift. Adding to the bullish case, we’re also seeing an inverse head & shoulders pattern forming, along with a bullish divergence, both of which increase the probability of an upward move.
💎If the price breaks out and closes candle above the resistance zone, it will confirm the pattern, setting the stage for a strong bullish move.
💎If the price breaks down and closes candle below the support zone, the bullish setup will be invalidated, and in that case, it’s best to stay patient and wait for a better price action setup.
🎖The market always gives opportunities, but only disciplined traders take full advantage. Stay sharp, Paradisers—patience and strategic execution are key to long-term success.
MyCryptoParadise
iFeel the success🌴

FTX Set to Begin Creditor Payouts in 2025: What It Means?The long-anticipated creditor repayments for FTX are finally set to commence, marking a pivotal moment in the exchange's financial restructuring. However, as with any major development in the crypto space, there are conditions, concerns, and market implications that traders need to be aware of. Here’s a breakdown of the upcoming FTX payout process and its potential impact on the price of $FTT.
FTX Creditor Payouts: Key Details
On February 18, 2025, certain FTX creditors will begin receiving their payouts, with those in the Convenience Class (claims up to $50,000) first in line. Under the restructuring plan, these creditors will receive 119% of their recorded claims, valued based on November 2022 asset prices, along with an additional 9% annual interest. However, all payments will be made strictly in stablecoins—excluding Bitcoin, altcoins, or any other crypto assets.
To receive payouts, users must complete KYC verification, submit tax documents, and select a distribution platform. Available payout platforms include Kraken and BitGo, but regional restrictions will apply, particularly in jurisdictions like Ukraine.
John J. Ray III, the chairman of the FTX liquidation committee, emphasized the importance of this step, stating:
"Today's announcement reflects the outstanding success of our recovery and coordination efforts over the past 28 months. These efforts are ongoing, and our focus remains on executing these distributions in accordance with our plan while also continuing to pursue the recovery of outstanding assets."
Scam Alerts and Delays in Compensation
As FTX prepares to distribute funds, scammers have seized the opportunity to defraud unsuspecting users. Fraudulent emails, phishing websites, and malware-laced links have surfaced, posing significant threats to creditors. Users are advised to only engage through official FTX channels and to verify any communications regarding payouts.
FTT Price Action: What’s Next?
The FTX Token ( TSX:FTT ) has experienced notable volatility amid these developments. At the time of writing, TSX:FTT is down 5.41%, trading in bearish territory, with eyes on its 1-month low as a support level.
A drop to this critical support zone could serve as an attractive entry point for traders, given that the level previously acted as resistance before flipping to support. If TSX:FTT manages to hold this range, it may attract fresh buyers looking for a reversal opportunity.
Conversely, a break above the 1-month resistance zone could trigger a strong influx of buyers, potentially leading to a 50% price surge. This scenario would depend on overall market sentiment and any further updates regarding FTX’s ongoing asset recovery efforts.
Market Sentiment and Final Thoughts
While the launch of FTX creditor repayments is a step forward in closing one of crypto’s biggest bankruptcy cases, uncertainties remain. Traders should monitor key technical levels for TSX:FTT while staying updated on regulatory and legal developments surrounding FTX’s liquidation.

FTTUSDT 1D#FTT is moving within a falling wedge pattern on the daily chart. Wait for a breakout to confirm a bullish signal. In case of a breakout, the targets are:
🎯 $2.1113
🎯 $2.4743
🎯 $2.8963
🎯 $3.2373
🎯 $3.5783
🎯 $4.0638
🎯 $4.6823

FTT ANALYSIS📊 #FTT Analysis
✅There is a formation of Falling Wedge Pattern on daily chart with a breakout and currently trading around its major support area🧐
Pattern signals potential bullish movement incoming after a successful retest
👀Current Price: $1.946
🚀 Target Price: $3.050
⚡️What to do ?
👀Keep an eye on #FTT price action and volume. We can trade according to the chart and make some profits⚡️⚡️
#FTT #Cryptocurrency #TechnicalAnalysis #DYOR

FTTUSDT UPDATEFTTUSDT is a cryptocurrency trading at $2.0820. Its target price is $3.2000, indicating a potential 60%+ gain. The pattern is a Bullish Falling Wedge, a reversal pattern signaling a trend change. This pattern suggests the downward trend may be ending. A breakout from the wedge could lead to a strong upward move. The Bullish Falling Wedge is a positive signal, indicating a potential price surge. Investors are optimistic about FTTUSDT's future performance. The current price may be a buying opportunity. Reaching the target price would result in significant returns. FTTUSDT is poised for a potential breakout and substantial gains.

FTT USDT#FTT ( TSX:FTT ) : Cup & Handle Pattern Indicates Bullish Reversal 🚀
🎯 Target 1: $4.2951
🎯 Target 2: $6.0266
🎯 Target 3: $7.4870
Get ready for a potential breakout with massive upside! 🔥

making this zone for long term perspective in ftt coindo your own research before following someone's signal blindly
i upload charts only for educational purpose.
