FTX/USDTesting/tracking elliot wave theory. Please do not trade off idea without S/L. Not financial advice.
On this chart I want you to look at a few things.
From the ATH we've dropped about 73% so far
A lot of the coins I've charted for you has gone to the 82% or more area. On the fib retracement, if you look at the white lines, below the 0.236 fib level
where the purple circle is; That is where majority of altcoins have retraced to so far. This coin has a high possibility of going below the 0.236 fib as well.
RR: 7.4
Possible Upside: 459%
Possible Downside: 65%
FTTUSDT trade ideas

FTTUSDT: Binance | Bearish Harmonic Patterns detected in LTFFew moments back I noticed Bullish Harmonic Pattern in 4H time frame which I have shared here already.
You can check that out here.
https://in(.)tradingview(.)com/chart/FTTUSD/JzgcmoGS-FTTUSD-Bullish-Crab-Detected/| Remove brackets to get link
Anyways let's continue this idea.
I have noticed Anti Nen Star as well as Cypher patterns in 1H time frame so I have opened short position here with below mentioned Entry, TP, and Stop Loss to scalp.
Pattern 1: Anti Nen Star: SHORT
----------------------------
Entry: 24.919
Take Profit: 24.64, 23.96, 23, 22.93
Stop Loss: 25.198
Pattern 2: Cypher: SHORT
----------------------------
Entry: 24.919
Take Profits: 24.43, 23.75, 22.93
Stop Loss: 25.408
Note: Once Take Profit 1 gets flipped i.e. becomes resistance I would move SL at entry and ride the trade.

FTTUSD Death Cross !!FTTUSD
3 Days time Frame
death cross in progress !!
breaking 21.699$ and close below should be good conformation
I will Wait for 9$ to buy and hold
Regards

FTTUSDTHello Crypto Lovers,
Mars Signals team wishes you high profits.
This is a one-day-time frame analysis for FTTUSDT
Here we have R1 as the resistance line and you observe the unsuccessful attempts of the price in order to rise. S1 is our support line and it includes the support of the price at several points. At the present, the price is fluctuating below R1 and above S1 in a triangular shape and we expect either the price will fall to S1 and then experiences a rise toward R1 (which is a good area to consider a long position). Also it is possible for the price to move above R1 and by receiving confirmation candles and a fixation over this line, we will expect more increase for it. It may happen that the price moves below S1 and face more decline.
Warning: This is just a suggestion and we do not guarantee profits. We advise you to analyze the chart before opening any positions.
Wish you luck

FTTUSD Return to Strong Trend LineFTT can be seen to have a very strong uptrend (in green) that is yet to be tested at these high levels it has reached
A return to this level coincides well with the 0.618 fib level, as shown by the curvy arrow
Bearish action will be brief but strong towards the trend line

FTT 6H BUYFTT 6H support is at ~$25.9
Enter 50% at the current price
and try to set some buy orders near the support zone
If FTT holds above the trendline,
the Take-Profit target would be 5%, 10%, and 15% from your entry
Cheers

FTX Token Bullish Divergence (55%+ Mapped)We have a very strong bullish divergence with the MACD and RSI on the FTTUSDT chart.
Notice the recent descending channel on FTTUSDT.
Here is the MACD, ascending channel:
Here is the RSI:
And Dogecoin (DOGEUSDT) went ahead and started moving right away.
You can check also Cardano (ADAUSD), Comos (ATOMUSDT), Bitcoin (BTCUSD) & more by visiting my profile.
www.tradingview.com
Namaste.

FTT Potential ReversalFTX could the the next Binance in my opinion.
They will integrate stock trading in their platform.
First price target was reached:
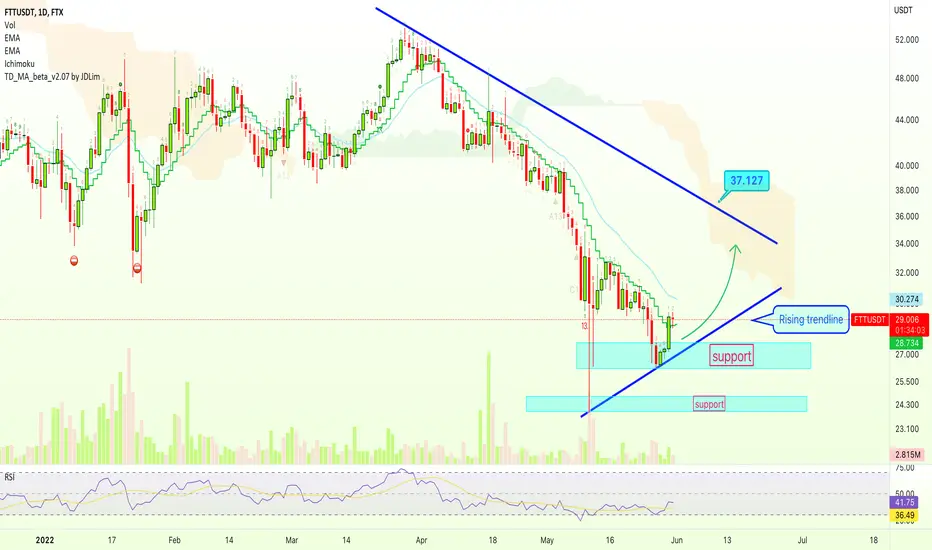
I see a potential reversal to the $37 resistance before heading lower later this year.
Looking forward to read your opinion about it.

FTT / USDTFTT / USDT
It lost its dynamic support line and fell to the $ 20 range.
This area can be a good support for this currency and increase its growth up to $ 30.
A range of $ 10 is available if not supported in this area.
#FTT #FTTUSDT #BTC #BTCUSD #LUNA #LUNC #UST

FTT BUY 4HPlease remember we are in a Bear Market, so Longs i dont recommend to be as heavy as Shorts.
That said, FTT is looking good. Buying in Low 27's with SL at 26.3
Interested to see what happens in FOMC FED meeting tomorrow! Maybe pump then dump.

FTTUSDT🔥 The market repeats another cycle of decline.
What can not be said about the FTT token
Support at the level of 22.5 does not look bad, for now I will just take the coin under observation, if the support at 22.5 flies, then we can expect a fall in the area of $ 11
✅Do not forget to visit the channel there is a lot of useful information about trading.
✅Write your comments what you think about this coin.

FTT Price PredictionDue to the markets condition i expect FTX Token FTT to touch the $22.24 support.
Looking forward to read your opinion about it.

FTTUSDTFTTUSDT
Target and time on chart.
Price target base on base on ichimoku price observation theory.

Ftt usdt 4h long ideaFtt could break long term descending trendline also break a falling wedge
Long scenario shown by green arrows
Comment your opinion about this analysis

FTT - Top-Down Analysis!Hello TradingView Family / Fellow Traders. This is Richard, as known as theSignalyst.
WEEKLY: Left Chart
FTT is overall bearish trading inside our brown channel. For the bulls to take over from a long-term perspective, we need a break above the upper brown trendline.
Meanwhile, since we are approaching a support zone in green around 25.0, we will be looking for buy setups on lower timeframes.
H4: Right Chart
FTT formed a valid channel in red but it is not ready to go yet.
Trigger => Waiting for a momentum candle close above the last high in gray to buy.
Meanwhile, until the buy is activated, FTT can still trade lower inside the support zone in green. In this case, we will be looking for new buy setups to form.
Always follow your trading plan regarding entry, risk management, and trade management.
Good luck!
All Strategies Are Good; If Managed Properly!
~Rich

FTT | Ready to Bounce Back..!!
#FTT/USDT (Update)
Descending channel Formation in Daily timeframe..!!
Looks Like Bottomed out, Ready to Bounce Back..📈
Please like the idea for Support & Subscribe for More ideas like this and share your ideas and charts in Comments Section..!!
Thanks for Your Love & Support..!!

Correction Done?So we're plotting this on log scale and it's quite clear we have completed 5 waves up and ABC down is in process/completed - I did have a look at the sub structure of C and can clearly see 5 waves down so there is a high chance that this correction has completed.

FTT/USDT BUYING SETUP (SWING)Buying #FTT/USDT (SWING)
$FTT breakout falling wedge pattern with big buy volume , RSI bullish divergence Valid and then MACD showing have golden cross, Price action and indicator support for bullish movement
we can entry now or wait for retest first
Buy zone : 27.50 - 26.5 - 25.3
Target : 30 - 32.35 - 35.27 - 39.27
Stop : 24

💡Don't miss the great buy opportunity in FTTUSD @FTX_Official
Trading suggestion:
". There is a possibility of temporary retracement to the suggested support line (26.38).
. if so, traders can set orders based on Price Action and expect to reach short-term targets."
Technical analysis:
. FTTUSD is in a range bound, and the beginning of an uptrend is expected.
. The price is below the 21-Day WEMA, which acts as a dynamic resistance.
. The RSI is at 63
Take Profits:
TP1= @ 29.55
TP2= @ 31.16
TP3= @ 32.67
TP4= @ 34.83
TP5= @ 37.62
SL= Break below S2
❤️ If you find this helpful and want more FREE forecasts in TradingView
. . . . . Please show your support back,
. . . . . . . . Hit the 👍 LIKE button,
. . . . . . . . . . Drop some feedback below in the comment!
❤️ Your support is very much 🙏 appreciated! ❤️
💎 Want us to help you become a better Forex / Crypto trader ?
Now, It's your turn !
Be sure to leave a comment; let us know how you see this opportunity and forecast.
Trade well, ❤️
ForecastCity English Support Team ❤️

FTT ShortBearish div on H4 and H1, already started to move down.
Would short but not on futures on KuCoin

FTX Token (FTT) Chart Analysis + Target & Support LevelsWe can see that FTTUSDT (FTX Token) managed to break above EMA10 on negligible volume... Which isn't really good but, once we have a bounce start to develop, we can see the counter-trendline being challenge, this is mapped on the chart.
We stay bullish above the "rising trendline".
We turn/switch/adapt to bearish below "support".
We aim at $35-$37 as bullish target on the next jump.
Namaste.
FTT great future ahead :) Fundamentals:
+ FTT native token with endless possibilities
+/- Relatively Risk-Off token within the crypto industry. This does not mean it should survive crypto winter better than others, but it is more of a relatively "Safe" opportunity.
Opinion:
FTX native token. The possibilities are endless.
This is not intended or made to constitute any financial advice.
Notes on how I personally use my charts/NFA:
Each level L1-L3 and TP1-TP3 has a deployment percentage. The idea is to flag these levels so I can buy 11% at L1 , 28% at L2 and if L3 deploy 61% of assigned dry powder. The same in reverse goes for TP. TP1: 61%, TP2:28% and TP3:11%. If chart pivots between TP's, in-between or in Between Sell levels these percentages are still respected. I like to use the trading range to accumulate by using this tactic.
Just my personal way of using this. This is not intended or made to constitute any financial advice.
This is not intended or made to constitute any financial advice.
FED Macro Situation Consideration:
All TP's are drawn within the context of a return to FED neutral policy. I do not expect these levels to be reached before tightening is over.
NOT INVESTMENT ADVICE
I am not a financial advisor.
The Content in this TradingView Idea is for informational purposes only, you should not construe any such information or other material as legal, tax, investment, financial, or other advice. Nothing contained within this idea constitutes a solicitation, recommendation, endorsement, or offer to buy or sell any securities or other financial instruments in this or in in any other jurisdiction in which such solicitation or offer would be unlawful under the securities laws of such jurisdiction.
All Content on this idea post is information of a general nature and does not address the circumstances of any particular individual or entity. Nothing in the idea/post constitutes professional and/or financial advice, nor does any information on the idea/post constitute a comprehensive or complete statement of the matters discussed or the law relating thereto. You alone assume the sole responsibility of evaluating the merits and risks associated with the use of any information or other Content on the idea/post before making any decisions based on such information.
