FTTUSDT Local S/R| .618 Fibonacci| 200 M| Price Action Evening Traders,
Today’s analysis – FTTUSDT – trading above its Local S/R where further upside is probable,
Points to consider,
- Price Action Impulsive
- Local S/R Support
- (.618 Fibonacci Confluence)
- 200 MA Support
- Swing High Objective
FTTUSDT’s immediate price action is impulsive, trading above its Local S/R that has technical confluence with the .618 Fibonacci and the 200 MA Support, allowing for a bullish bias.
The immediate objective is swing high, exceeding this level will increase the probability of a trend continuation.
Both oscillators are trading in over-extended conditions, a reversal back to their bullish control zones will be indicative of strength.
Overall, in my opinion, FTTUSDT is a valid long with defined risk, price action is to be used upon discretion/ management.
Hope this analysis helps
Thank you for following my work
And remember,
"Limit your size in any position so that fear does not become the prevailing instinct guiding your judgment" - Joe Vidich
FTTUSDT trade ideas

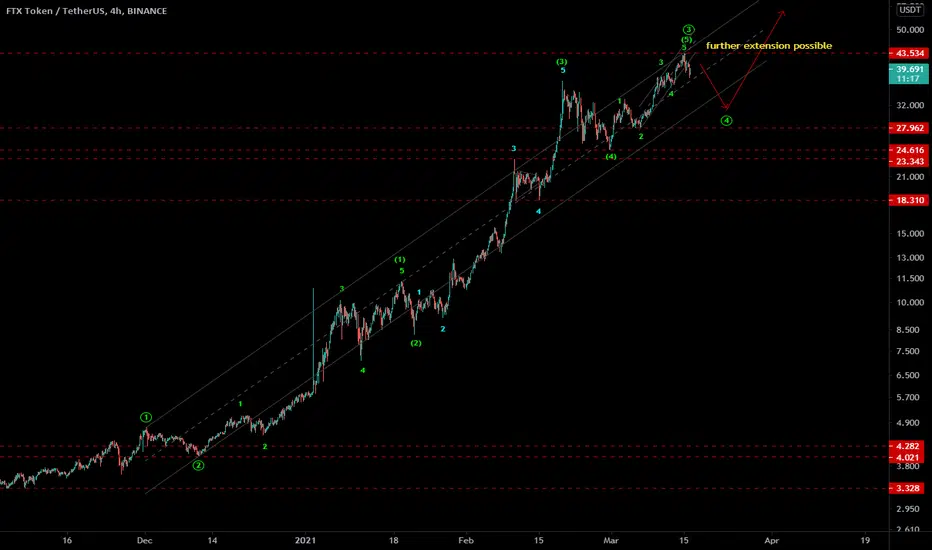
FTTUSDT - EW analysis - correction time of 4th wave FTTUSDT - It seems like 3rd wave is completed and 4th wave correction is in play, which might end near 28-26 zone before it resume the next cycle. Here also there is a possibility of 5th subwave extension, so if it crosses the last high then it may continue the up move.
Give thumbs up if you really like the trade idea/analysis.
FTT CALL MATURED IN 3 DAYS 34% GAINSFTT CALL MATURED IN 3 DAYS 34% GAINS
Forget #DOGE #DOGECOIN Try #ftt add us to your like / watch list
We hope you find our charts of use, please hit the like button if you found this chart useful.
Safe trading everyone

FTTUSDT - 1HOURFTT in a nice hourly uptrend! The 12 EMA is acting very well as support!
For every new follower i will add a new idea :)

FTTUSDT - BUY NOW !Welcome to our Trade Setups - March 13th ( FTTUSDT ) !
BUY FTTUSDT
ENTRY LEVEL @ 40.349
SL @ 37.004
TP @ 46.891
Max Risk: 1% - 3%!
Risk/Reward Ratio: 2
Leave us a comment or like to keep our content for free and alive.
Have a great week everyone!


FTTUSDT Trading ChannelIt is quite easy to make a trading plan with this channel.
Buy when the price hold above middle line or buy from bottom of this channel


FTT 1H BUYAlso set some Buy orders near the Trendline
Remember no more than 5% of the deposit in one trade
SL: next sell signal

FTTUSDT is testing the 4h resistance 🦐FTTUSDT is testing the 4h resistance, after a nice breakout from a descending channel. IF the price will have a breakout upward, According to Plancton's strategy (check our Academy), we can set a nice order
–––––
Follow the Shrimp 🦐
Keep in mind.
🟣 Purple structure -> Monthly structure.
🔴 Red structure -> Weekly structure.
🔵 Blue structure -> Daily structure.
🟡 Yellow structure -> 4h structure.
⚫️ Black structure -> <4h structure.
Here is the Plancton0618 technical analysis, please comment below if you have any question.
The ENTRY in the market will be taken only if the condition of the Plancton0618 strategy will trigger.

FTTUSDT - EW analysis - 5th of 3rd wave upFTTUSDT - It is in 5th of 3rd wave up in 2 hr time frame. Wait for slight pull back of internal 2nd wave to get in to trade with stop level below 24.61 for target as new high.
Give thumbs up if you really like the trade idea/analysis.

FTT - ready for parabolic move?This is not a financial advice. Always do your own research and always put stoploss in your trade (SL) :) If you want more detailed info how to study and read charts or just need help with some coin, just write to me here a comment, i will try to answer to everybody... i can help you :) all for free, don't worry, BE HAPPY!
If u like the analysis, please feel free to ask any question about this TA or crypto or any coin and also leave a comment or like or share the idea, i really appreciate it because then my work makes sense :) thanks!


💡Don't miss the great buy opportunity in FTTUSDT @FTX_OfficialTrading suggestion:
. There is a possibility of temporary retracement to the suggested support line (25.50).
. If so, traders can set orders based on Price Action and expect to reach short-term targets.
Technical analysis:
. BNBUSD is in an uptrend, and the continuation of the uptrend is expected.
. The price is above the 21-Day WEMA, which acts as a dynamic support.
. The RSI is at 63.40.
Take Profits:
TP1= @ 31.40
TP2= @ 33.40
TP3= @ 35
TP4= @ 36.80
TP5= @ 38.60
SL= Break below S2
❤️ If you find this helpful and want more FREE forecasts in TradingView
. . . . . Please show your support back,
. . . . . . . . Hit the 👍 LIKE button,
. . . . . . . . . . Drop some feedback below in the comment!
❤️ Your Support is very much 🙏 appreciated!❤️
💎 Want us to help you become a better Forex trader?
Now, It's your turn!
Be sure to leave a comment. Let us know how you see this opportunity and forecast.
Trade well, ❤️
ForecastCity English Support Team ❤️

🔥 FTT Channel Break-OutFTT has seen some incredible gains over the last couple of hours, helped by Bitcoin's strong returns as of earlier this morning.
FTT has breached the downward sloping channel a few hours ago, signaling us of a new potential bull-run. Before the bull-run happens I'm expecting a small decline towards the channel resistance.
Before entering this trade wait for the price to touch the Entry line.
On the chart I’ve marked two potential areas of resistance, R1 and R2. These areas are based on recent swing highs and round numbers. Do your own due diligence.
Happy trading!

FTTUSDT - Long - Potential 14.83%FTTUSDT - Long - Potential 14.83%
Entry- 28.228
TP1- 29.440
TP2- 32.413
SL- 25.372
- Trigger - Volume / TD9
- BTC - Price Rising - Alts rising
- RR - 1.5
- Trailing Buy - 1%
- Trailing Profit - 1%
- Trailing Stop-Loss - no

FTT 1H BUYAlso set some Buy orders near the Trendline
Remember no more than 5% of the deposit in one trade
SL: next sell signal


🆓FTX Token/USDT Analysis (23/2) #FTT $FTTThe strong buying force continues to pour into FTT in this February, showing the possibility of FTT's price increase, but because the market health is quite weak, FTT is currently still dominated by selling, but not because of the strong selling force, but because the buying force is temporarily paused.
As long as FTT surpasses $32 zone, strong buying force will push in to help FTT rise to $46 and even $64 zones.
📅NEWS
No News
📈BUY
-Buy: 26.5-28.5$. SL if B
-Buy: 31.5-33.5$ if A. SL if B
📉SELL
-Sell: 45-47$. SL if A
-Sell: 64-66$. SL if A
♻️BACK-UP
-Sell: 26.5-28.5$ if B. SL if A
-Buy: 20-22$.SL if B
❓Details
Condition A : "If 8H candle closes ABOVE this zone"
Condition B : "If 8H candle closes BELOW this zone"
