FUN/USDTKey Level Zone: 0.005300 - 0.005470
HMT v8.1 detected. The setup looks promising, supported by a previous upward/downward trend with increasing volume and momentum, presenting an excellent reward-to-risk opportunity.
HMT (High Momentum Trending):
HMT is based on trend, momentum, volume, and market structure across multiple timeframes. It highlights setups with strong potential for upward movement and higher rewards.
Whenever I spot a signal for my own trading, I’ll share it. Please note that conducting a comprehensive analysis on a single timeframe chart can be quite challenging and sometimes confusing. I appreciate your understanding of the effort involved.
Important Note :
Role of Key Levels:
- These zones are critical for analyzing price trends. If the key level zone holds, the price may continue trending in the expected direction. However, momentum may increase or decrease based on subsequent patterns.
- Breakouts: If the key level zone breaks, it signals a stop-out. For reversal traders, this presents an opportunity to consider switching direction, as the price often retests these zones, which may act as strong support-turned-resistance (or vice versa).
My Trading Rules
Risk Management
- Maximum risk per trade: 2.5%.
- Leverage: 5x.
Exit Strategy
Profit-Taking:
- Sell at least 70% on the 3rd wave up (LTF Wave 5).
- Typically, sell 50% during a high-volume spike.
- Adjust stop-loss to breakeven once the trade achieves a 1.5:1 reward-to-risk ratio.
- If the market shows signs of losing momentum or divergence, ill will exit at breakeven.
The market is highly dynamic and constantly changing. HMT signals and target profit (TP) levels are based on the current price and movement, but market conditions can shift instantly, so it is crucial to remain adaptable and follow the market's movement.
If you find this signal/analysis meaningful, kindly like and share it.
Thank you for your support~
Sharing this with love!
HMT v2.0:
- Major update to the Momentum indicator
- Reduced false signals from inaccurate momentum detection
- New screener with improved accuracy and fewer signals
HMT v3.0:
- Added liquidity factor to enhance trend continuation
- Improved potential for momentum-based plays
- Increased winning probability by reducing entries during peaks
HMT v3.1:
- Enhanced entry confirmation for improved reward-to-risk ratios
HMT v4.0:
- Incorporated buying and selling pressure in lower timeframes to enhance the probability of trending moves while optimizing entry timing and scaling
HMT v4.1:
- Enhanced take-profit (TP) target by incorporating market structure analysis
HMT v5 :
Date: 23/01/2025
- Refined wave analysis for trending conditions
- Incorporated lower timeframe (LTF) momentum to strengthen trend reliability
- Re-aligned and re-balanced entry conditions for improved accuracy
HMT v6 :
Date : 15/02/2025
- Integrated strong accumulation activity into in-depth wave analysis
HMT v7 :
Date : 20/03/2025
- Refined wave analysis along with accumulation and market sentiment
HMT v8 :
Date : 16/04/2025
- Fully restructured strategy logic
HMT v8.1 :
Date : 18/04/2025
- Refined Take Profit (TP) logic to be more conservative for improved win consistency
Update idea
Add note
Ren_MomentumTrader
Also on:
Disclaimer
The information and publications are not meant to be, and do not constitute, financial, investment, trading, or other types of advice or recommendations supplied or endorsed by
FUNUSDT trade ideas

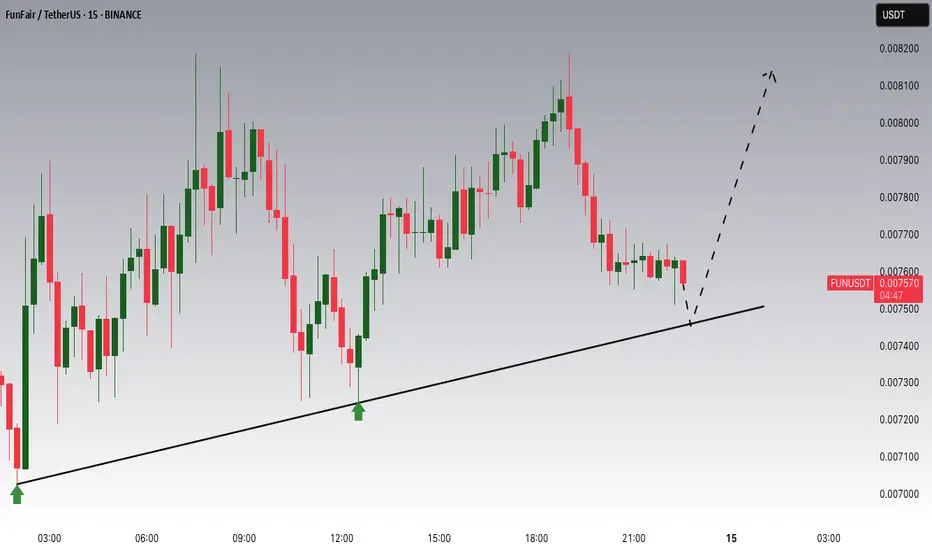
FUN Testing Red Resistance – Breakout Potential! 🚀 FUN Testing Red Resistance – Breakout Potential! 📈
FUN is currently testing the red resistance zone. If the price breaks through, the first target could be the green line level! 📊
Let’s catch this breakout together! 💼💸

FUNUSDT Nice measured move to look for on the short side down to the next order block, or a retrace on the fib. some nice FUN swings in effect. watching the b profile( favoring sellers) as it builds this potential failing checkmate. A short for a dubbler from 0.0055 down to 0.0025. That sounds FUN'. n yes i spelled dubbler on purpose.


FUN/USDT In an Uptrend, Watching for Correction at Key SupportFUN/USDT has been in a solid uptrend, but we are now seeing a correction phase. The price is approaching a critical support zone around 0.007460, where previous price action has shown both support and resistance. This level is important to watch, as it could provide a potential buying opportunity if price reacts here. A break below could suggest further downside, but if support holds, a bounce toward the recent highs is possible. Monitoring closely for confirmation at this key level.
FUNUSDTLooking for the third leg in the trend? being prepared is the best i can do.
Why not go have a little "FUN" while everyone else is tied up in QT. I really like how the monthly and the weekly stochastics are both up. Maybe some volume coming?? Holding this Breaker block, Not to mention the anchored VWAP.. And, did I mention its above all the Daily Moving Averages. So a third leg to 1 penny? Makes cents to have a little fun.

Phemex Analysis #72: Pro Tips for Trading FunToken (FUN)FunToken ( PHEMEX:FUNUSDT.P ) has surged in the crypto market, rising over 270% in the past month. This surge is attributed to its integration with the Binance Smart Chain (BSC) and the release of a roadmap that focuses on mobile gaming. Unlike many GameFi projects that prioritize web/desktop games, FUN is focusing on the mobile gaming sector, with plans to launch 40 mobile games featuring an "Earn-While-You-Play" mechanism. This strategic direction has generated significant market excitement regarding its growth potential.
Possible Scenarios
To provide a framework for trading FUN, let's explore potential scenarios based on technical analysis and market dynamics:
1. Bullish Breakout Continuation
If FUN sustains its upward momentum and breaks through key resistance levels with strong volume, it could signal a continuation of the bullish trend.
Pro Tips:
Identify key resistance levels, such as $0.85 and $0.89.
Consider entering a long position on a confirmed breakout above resistance with increasing volume and a high RSI (such as above 70).
Set a stop-loss order below the breakout point to manage risk.
2. Consolidation and Range Trading
After a significant price increase, FUN may enter a period of consolidation, trading within a defined range.
Pro Tips:
Identify key support ($0.006) and resistance levels ($0.009) that define the trading range.
Consider range-bound trading strategies, such as buying near support and selling near resistance; or consider using Phemex Grid Bots to capitalize on small price movements.
Remember to place stop-loss orders outside the range to prepare for potential breakouts or breakdowns.
3. Bearish Retracement.
A significant price surge is often followed by a retracement, especially as the broader market sentiment is currently bearish. If FUN fails to hold support levels ($0.006), it could experience a bearish retracement.
Pro Tips:
Monitor key support levels ($0.0064, $0.006).
Consider exiting long positions or reducing exposure if strong bearish signals appear.
Consider shorting opportunities on a break below key support, but exercise caution and manage risk carefully.
Conclusion
FUN Token's recent price action has demonstrated significant bullish momentum, driven by its strategic focus on the mobile gaming sector and its integration with the Binance Smart Chain. Traders should closely monitor price action, volume, and key support and resistance levels to identify potential trading opportunities. By considering various market scenarios and implementing appropriate risk management strategies, traders can navigate the volatility of the cryptocurrency market and capitalize on potential trends in FUN Token.
Tips:
🔥 Break free from "buy low, sell high"! Our new Pilot Contract empowers you to profit from ANY market direction on DEX coins with up to 3x leverage. Go long, go short, go further!
Check out Phemex - Pilot Contract today!
Disclaimer: This is NOT financial or investment advice. Please conduct your own research (DYOR). Phemex is not responsible, directly or indirectly, for any damage or loss incurred or claimed to be caused by or in association with the use of or reliance on any content, goods, or services mentioned in this article.


a chance to short FUNa chance to short FUN.
FUN has a big chance of finishing the uptrend.
short this with stop loss

FunUSDT Weekly Outlook, Key Support RegionHello traders,
In today’s altcoin update we’re looking at FunUSDT on the weekly timeframe. Price action is showing signs of strength, currently respecting the point of control and trading above the value area low, which is providing a strong technical base.
Key Technical Points:
• Break Above Value Area High: Price impulsively moved through the value area high and tapped into the 0.618 Fibonacci, before facing rejection.
• Critical Support Zone: Holding above the previous value area high is key for any further continuation to the upside.
• Target: If price consolidates above value with increasing volume, there is potential for a move back toward the swing high at 0.01.
The recent breakout shows momentum, but for continuation higher, weekly consolidation above value is essential. This will confirm buyer commitment and allow a new leg up toward the swing high.
If, however, the value area high fails to hold as support, we could see price rotate back toward the lows. This is a high-risk setup, so close attention to volume and weekly structure is necessary before committing to any directional bias.

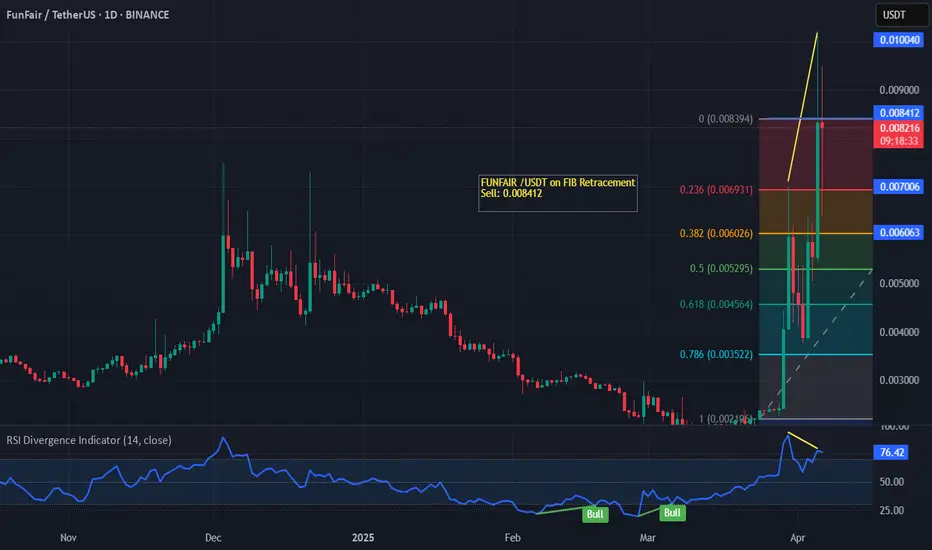
FUNUSDT(FUNToken) Updated till 05-04-25FUNUSDT(FUNToken) Daily timeframe range. while other alts going banana this thing doing pretty well till now. continuous push till 0.010245 which is local resistance. if it can have a confirm close above 0.006676 it will retrace back to 0.010245.

FUNUSDT showing Divergence on Daily Time FrameFUN/USDT after making the falling wedge pattern went for again testing the highest level of the daily timeframe, is now showing divergence and will go down . No long trades are suggested right now. The traders should wait for the right set up, if found for downward or short trade.

FUNUSDT CHART ANALYSİS - EDUCATIONAL POSTThe NFT Concept
You may already know that each unit of value in a blockchain is called a token. In an open blockchain, all tokens are equal and interchangeable. For example, one bitcoin can be easily replaced with another, and nothing will change.
Non-fungible tokens are a game-changer, which work differently. An NFT is a digital asset that cannot be replaced with another token without changing the value and basis of the object.
Like cryptocurrency, NFTs are created on a blockchain, which acts as a database to record all transactions. The blockchain guarantees the uniqueness, safety, and anonymity of non-fungible tokens. Thanks to this system, any user can verify the originality and transparency of the history of a particular NFT through the blockchain.
When you buy an NFT token, you are obtaining a certificate for a digital or real object. However, the work itself doesn’t move anywhere. You only use its digitized file or a certificate of ownership. Once created or purchased, the token sits in perpetual storage. This certificate is just lines of code that confirm it is the token owner who has the original copy of the object.
An NFT token can be compared to a painting, which may belong to a gallery, museum, or individual, but the audience can see it in a catalog or exhibition.
NFT tokens are sold in online marketplaces that operate like Amazon. The creators put them on marketplaces and wait for bids from buyers.
An NFT token can be created by you or by anyone for that matter. To do this, you need to take a digital object (picture, music, photo, etc.), register in a particular marketplace on a platform such as Rarible or OpenSea, and upload the object with a description and price. You will have to pay a fee for creating a blockchain entry on many platforms. However, the costs pay off in most cases, as NFTs are #1 in the crypto world today.

$BINANCE:FUNUSDT NEW SETUPThis setup idea is not finished yet, but the trade is already running. The first target is the 0.618 Fibonacci level. I will update this setup later.
FunToken has not yet achieved its market capitalization of $51M. It is currently around GETTEX:26M , so there is still plenty of opportunity to jump in

FUNUSDTLooking for 1 more daily candle. Stay in the channel. Not sure what to explain. It's pretty self explanatory. Fail or not it's still FUN..

FUNUSDT: 120% Daily Volume Surge – A Bullish Breakout Brewing?FUNUSDT Analysis
Big Volume, Big Opportunity – Watch for the Break
"FUNUSDT shows a solid 120% daily volume increase – this is the kind of move that gets attention. Opportunities like this? You can’t ignore them."
Here’s the Plan:
Blue Box Zone: If we see the bullish breakout on the chart, I’m ready to go long from around the blue box. These levels are far from bad – they’re where winners trade.
Confirmation is Key: Wait for the breakout to signal strength. As always, use CDV, volume profile, and other data to ensure the trade has the support it needs.
Key Observations:
"The blue box is carefully chosen using volume footprint, CDV, and liquidity heatmap. Look for upward market structure breaks in lower time frames to confirm your entry."
This could be the start of something big for HIVEUSDT. Play it smart, trade it strong. 🚀
Let me tell you, this is something special. These insights, these setups—they’re not just good; they’re game-changers. I've spent years refining my approach, and the results speak for themselves. People are always asking, "How do you spot these opportunities?" It’s simple: experience, clarity, and a focus on high-probability moves.
Want to know how I use heatmaps, cumulative volume delta, and volume footprint techniques to find demand zones with precision? I’m happy to share—just send me a message. No cost, no catch. I believe in helping people make smarter decisions.
Here are some of my recent analyses. Each one highlights key opportunities:
🚀 RENDERUSDT: Strategic Support Zones at the Blue Boxes +%45 Reaction
🎯 PUNDIXUSDT: Huge Opportunity | 250% Volume Spike - %60 Reaction Sniper Entry
🌐 CryptoMarkets TOTAL2: Support Zone
🚀 GMTUSDT: %35 FAST REJECTION FROM THE RED BOX
🎯 ZENUSDT.P: Patience & Profitability | %230 Reaction from the Sniper Entry
🎯 DEXEUSDT %180 Reaction with %9 Stop
🐶 DOGEUSDT.P: Next Move
🎨 RENDERUSDT.P: Opportunity of the Month
💎 ETHUSDT.P: Where to Retrace
🟢 BNBUSDT.P: Potential Surge
📊 BTC Dominance: Reaction Zone
🌊 WAVESUSDT.P: Demand Zone Potential
🟣 UNIUSDT.P: Long-Term Trade
🔵 XRPUSDT.P: Entry Zones
🔗 LINKUSDT.P: Follow The River
📈 BTCUSDT.P: Two Key Demand Zones
🟩 POLUSDT: Bullish Momentum
🌟 PENDLEUSDT.P: Where Opportunity Meets Precision
🔥 BTCUSDT.P: Liquidation of Highly Leveraged Longs
🌊 SOLUSDT.P: SOL's Dip - Your Opportunity
🐸 1000PEPEUSDT.P: Prime Bounce Zone Unlocked
🚀 ETHUSDT.P: Set to Explode - Don't Miss This Game Changer
🤖 IQUSDT: Smart Plan
⚡️ PONDUSDT: A Trade Not Taken Is Better Than a Losing One
💼 STMXUSDT: 2 Buying Areas
🐢 TURBOUSDT: Buy Zones and Buyer Presence
🌍 ICPUSDT.P: Massive Upside Potential | Check the Trade Update For Seeing Results
🟠 IDEXUSDT: Spot Buy Area | %26 Profit if You Trade with MSB
📌 USUALUSDT: Buyers Are Active + %70 Profit in Total
🌟 FORTHUSDT: Sniper Entry +%26 Reaction
🐳 QKCUSDT: Sniper Entry +%57 Reaction
📊 BTC.D: Retest of Key Area Highly Likely
This list? It’s just a small piece of what I’ve been working on. There’s so much more. Go check my profile, see the results for yourself. My goal is simple: provide value and help you win. If you’ve got questions, I’ve got answers. Let’s get to work!

Crypto Pick of the Day: FUNUSDT (Spot)
🌟 Take the Fun to the Next Level with FUNUSDT! 🌟
🌍 Market Overview:
FUNUSDT is signaling a strong potential for growth in the short term. With a well-defined entry range and solid risk-reward ratio, this is an excellent opportunity to ride the next wave.
📊 Trade Plan:
📌 Entry: $0.00456 - $0.006 – Ideal accumulation zone with controlled risk.
🎯 Target: x1.5 – Aiming for a strong 50% profit gain.
⏳ Hold Time: Maximum 2 weeks – Perfect for short-term traders seeking quick returns.
🔍 Strategy Insights:
My custom indicator RainBow MG3 confirms strong bullish momentum in the short-term timeframe.
Market conditions and volume trends suggest FUNUSDT is primed for an upside move.
🚀 Next Steps:
💬 Connect with me if you need personalized advice or support!
💡 Note: This is not financial advice. Always DYOR before trading.
🔥 FUNUSDT is ready to move – Don’t miss out on the ride! 🔥

FUN/USDT Analysis $FUN/USDT Analysis 📊
#FUNE Current Price: $0.005131
Trend Breakout from a falling wedge indicates bullish momentum.
Look for a retest of $0.004603 as an entry. Confirmation above $0.006 may signal a move toward T1 and higher targets. 📈🚀
Targets:
T1: $0.010012 🎯
T2: $0.012312
T3: $0.014852

FUNUSDT We can attempt to buy FUNUSDT from specified level as it makes HL , also 0.618 FIB level intact indicate that it moves upward.
SL , TP mention in chart

#FUN/USDT Ready to go higher#FUN
The price is moving in a descending channel on the 1-hour frame and sticking to it well
We have a bounce from the lower limit of the descending channel, this support is at a price of .005113
We have a downtrend on the RSI indicator that is about to be broken, which supports the rise
We have a trend to stabilize above the moving average 100
Entry price 0.005590
First target 0.006100
Second target 0.006663
Third target 0.007416

FUNUSDT 1WFUN ~ 1W
#FUN If you still have Conviction on this coin. Buy in stages within this Block. with a minimum target of 20%++
This trade is high risk. Forget it if you are a trader who plays it safe.

Fun Token Prepares 2,750% Bull-MarketFUNUSDT (Fun Token) is breaking this week above EMA55 and EMA89 with a very strong green candle. This candle is strong in size but contains low volume. This low volume as a chart signal can be read to mean that the real action is yet to start; that is to say, this is only the beginning...
Good morning my fellow Cryptocurrency trader, the Altcoins market continues to heat up. We will see pairs growing, growing big, growing fast, growing strong for years to come. There are so many pairs right now, that the market will continue bullish long-term. When a set of Altcoins move lower, another set will advance so there is never a marketwide retrace.
It is happening even now. Some pairs are retracing (which means a small correction) and while this retrace happens other pairs are moving up strong. This is bull-market dynamics and will continue to unravel all through 2025 and the remaining part of 2024.
FUNUSDT is now green and growing, but this is only the beginning. Seeing the chart, even with such a strong bullish breakout, we have 210% potential short-term. 537% mid-term and up to 1,675% long-term. If things become really good, as it is already happening, final target can go to 0.17 which would be 2,750% total growth from current price.
Awesome.
Thank you for reading.
Namaste.
