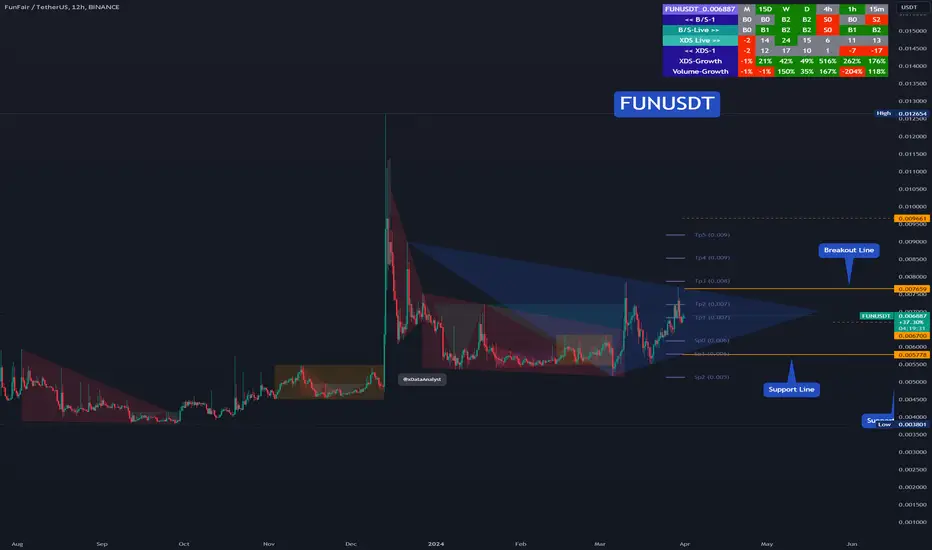
#FUN is crazy guyNYSE:FUN is sitting on the breakup line strong. If market moves up, FUN may rocket. Orange boxes are the support and resistance zones.
FUNUSDT trade ideas

FUNUSDT | FUN TOKEN ideaFUNUSDT | FUN TOKEN idea
breakout and support line both are opportunities
set ur alert accordingly

$FUN will push hardAfter long accumulation , #FUN tried a fake out but now is the 2nd chance?
NOT FINANCIAL ADVICE.

#FUN/USDT - Long - Potential 20.39%Strategy: Long
Exchange: BINANCE
Account: Spot
Entry mode: Market order in range
Invest: 5%
Exit:
• Target 2 : 0.007173 21.29%
• Target 1 : 0.006351 7.39%
Entry: 0.005914 ⌁ 0.005914
• Current market price: 0.005914
Stop: 0.005307 (-10.26%)
Technical indicators:
Falling wedge breakout with volume, RSI trendbreak and 50+, solid support
• ⎿ 24h Volume: 2553656.837363
• ⎿ Satoshis: 0.005914
• ⎿ Analysis: TradingView

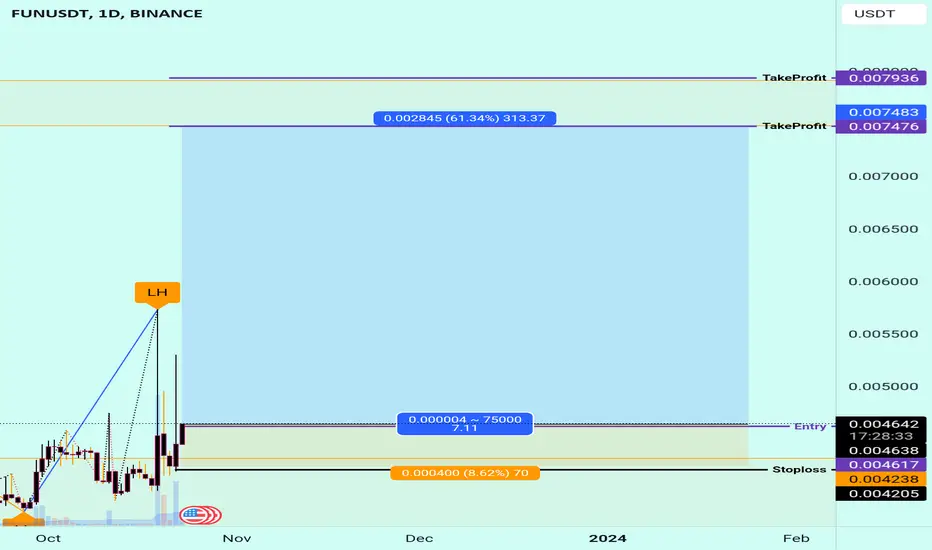
FUNUSDT is BullishFUN has given a breakout from the consolidation phase and has printed a new higher high. It is currently printing a new higher low at around 0.382 fib retracement level, which is the suggested entry point for this setup. A bullish rally is expected from here. Targets are mentioned on the chart.

FUNUSDT .... BULL TRENDThe coin has given a bullish breakout from accumulation zone and has printed series of HHs and HLs. Chart suggest that a long position may be taken with defined SL

#Funusdt#Fun
The market is currently testing a multi-year trend line. If the market breaks out above the trend line, we can expect a 200% bullish rally in the coming weeks.

#FUN/USDT#FUN
The price has broken the rising resistance line.
He tested it again on a frame for several days.
The resistance line has always been very strong but now it will act as support after breaking it again.
Bearish triangle patterns on every breakout to the upside and currently the big bearish triangle will break out.
The current entry areas are at the current support areas 0.0043.
It is expected to rise to areas 0. 011
meaning an expected rate of 120%.

Volume-Driven Opportunity on FUNUSDT: Potential 150% Profit🚀 Trade Overview:
I've identified an exciting trading opportunity on the FUNUSDT pair on Binance, leveraging the power of volume analysis for potential substantial gains.
📈 Entry Point:
Initiate the trade now at 0.006239. The decision is rooted in the belief that volume is the true catalyst for market movements, as opposed to relying solely on price action.
🎯 Exit Point:
Set your exit target at 0.015715, aiming for 150% profit. This target is strategically chosen based on the volume analysis, which suggests strong potential for significant upward movement.
🔍 Analysis Method:
The entire analysis is grounded in a robust examination of volume trends. Understanding that volume precedes price, this approach allows for a more proactive and insightful trading strategy.
📣 Disclaimer:
Trading involves risk, and past performance is not indicative of future results. This idea is for educational purposes only. Always conduct your own research and consider your risk tolerance before making any financial decisions.
👉 Note:
This trade idea is based on the analysis of the volume, providing a unique perspective on market dynamics. As with any trade, it's essential to stay informed, adapt to changing conditions, and make decisions based on a comprehensive understanding of the market. Good luck, and may the markets be in your favor! 🌐📈

#FUN/USDT rally is on the wayA stable and rapid upward trend is about to begin by the end of the year...
***It is not investment advice!

FUN USDT - BULLISH OUTLOOKFUNUSDT is exhibiting a compelling technical setup based on recent price action analysis, particularly on the 4-hour timeframe. The cryptocurrency is displaying a bullish divergence on the RSI, suggesting a potential reversal for a bullish trend.
Here's a summary of the potential trading opportunity:
Entry: Consider entering a long position at $0.004701
Stop Loss (SL): Set the stop loss at $0.004528 to manage potential downside risk.
Take-Profit Levels:
TP 1 @ 1:1 = $0.004874.
TP 2 @ 1:2 = $0.005046.
TP 3 @ 1:3 = $0.005219.
TP 4 @ 1:4 = $0.005391.
This trade plan is designed to take advantage of the observed bullish divergence on the RSI, indicating a potential reversal for a bullish trend. Managing risk through a stop loss and setting multiple take-profit levels aligns with a comprehensive trading strategy. As always, it's important to stay informed and adapt to changing market conditions for successful trading.

FUN is Ready To Give aus Some Fun. Catch It**Short Fondamental**
Fun Coin is a decentralized digital currency that was launched in 2022. It is based on the Ethereum blockchain and uses the ERC-20 token standard. Fun Coin has a fixed total supply of 100 billion tokens.
Fun Coin is designed to be a fun and easy-to-use currency. It has a low transaction fee and can be used to purchase goods and services from a variety of merchants. Fun Coin is also listed on several cryptocurrency exchanges, making it easy to buy and sell.
**Recent News**
* On October 17, 2023, Fun Coin was announced as the official payment method for the Fun Fest, a music and arts festival that will be held in Las Vegas in May 2024.
* On October 21, 2023, Fun Coin partnered with the Fun Wallet, a mobile cryptocurrency wallet, to make it easier for people to use and store Fun Coin.
**Disclaimer**
Investing in cryptocurrencies is a risky investment. Prices can fluctuate wildly and there is always the possibility of losing money. Before investing in any cryptocurrency, it is important to do your own research and understand the risks involved.
Please note that I am not a financial advisor and this is not financial advice.
FUN/USDT - FunFair: Trend_Reversal◳◱ An intriguing development has unfolded on the NYSE:FUN / CRYPTOCAP:USDT chart as we've identified a compelling Trend Reversal. This shift in price dynamics indicates a noteworthy potential trend change. It's crucial for us to pay attention to the next resistance levels located at 0.004666 | 0.005122 | 0.005956 and the significant support levels found at 0.003832 | 0.003454 | 0.00262. Taking these factors into consideration, it may be prudent to contemplate entering a buy position at the current price of 0.004637, allowing us to take advantage of the projected trend continuation.
Let's keep a watchful eye on this exciting opportunity and stay proactive in our trading strategies.
◰◲ General info :
▣ Name: FunFair
▣ Rank: 386
▣ Exchanges: Binance, Gateio, Mexc, Hitbtc
▣ Category/Sector: Media and Entertainment - Gambling
▣ Overview: FunFair is building a decentralized casino platform for transparent and fair online gambling.
◰◲ Technical Metrics :
▣ Mrkt Price: 0.004637 ₮
▣ 24HVol: 4,814,575.966 ₮
▣ 24H Chng: 9.908%
▣ 7-Days Chng: 15.68%
▣ 1-Month Chng: 25.23%
▣ 3-Months Chng: 17.80%
◲◰ Pivot Points - Levels :
◥ Resistance: 0.004666 | 0.005122 | 0.005956
◢ Support: 0.003832 | 0.003454 | 0.00262
◱◳ Indicators recommendation :
▣ Oscillators: NEUTRAL
▣ Moving Averages: STRONG_BUY
◰◲ Technical Indicators Summary : BUY
◲◰ Sharpe Ratios :
▣ Last 30D: 1.50
▣ Last 90D: 0.02
▣ Last 1-Y: -0.30
▣ Last 3-Y: 0.53
◲◰ Volatility :
▣ Last 30D: 0.64
▣ Last 90D: 0.78
▣ Last 1-Y: 0.87
▣ Last 3-Y: 1.13
◳◰ Market Sentiment Index :
▣ News sentiment score is N/A
▣ Twitter sentiment score is 0.44 - Bearish
▣ Reddit sentiment score is 0.65 - Bullish
▣ In-depth FUNUSDT technical analysis on Tradingview TA page
▣ What do you think of this analysis? Share your insights and let's discuss in the comments below. Your like, follow and support would be greatly appreciated!
◲ Disclaimer
Please note that the information and publications provided are for informational purposes only and should not be construed as financial, investment, trading, or any other type of advice or recommendation. We encourage you to conduct your own research and consult with a qualified professional before making any financial decisions. The use of the information provided is solely at your own risk.
▣ Welcome to the home of charting big: TradingView
Benefit from a ton of financial analysis features, instruments and data. Have a look around, and if you do choose to go with an upgraded plan, you'll get up to $30.
Discover it here - affiliate link -

FUNTOKEN new volume 💣💡Hello 🐋
based on the chart
the price is close to daily supports and new volume again for the price 📖💡
we expect to see more gain for the price in log term targets 🚀💣
before
more gain, we can see even correction to the downside ❌🧨
and
range market is logical too 💡
Please, feel free to share your point of view, write it in the comments below, thanks 🐋

Finally Fun Testing Crucial trendline Seems Like Ready for Massive Breakout Testing Trendline In 3 days tf Incase Of Successful breakout Expecting Massive Bullish Rally In Midterm (expecting 200 to 220% bullish Wave In Midterm)

FUNUSDTFUNUSDT is in entring into the bullish trend.
No divergence which mean trend is continue.
we wait and watch for the breakout of first HH>

#FUN/USDT - Long - Potential 4.14%Direction: Long
Market: Spot
Risk: 0.25% - 1%
#USDT_FUN
Exchange: BINANCE
Timeframe: 360
TP1: 0.005286
Entry: 0.005128
STOP: 0.00497
Entry Conditions:
| Trendbreak
| CDV resistance break

after break outDO NOT FORGET USING A STOP LOSS
Warning:
This is just a suggestion and we do not guarantee profits. We advise you analyze the chart before opening any position.
I hope you are always profitable

#FUN/USDT - Long - Potential 2.65%Direction: Long
Market: Spot
Risk: 0.25% - 1%
#USDT_FUN
Exchange: BINANCE
Timeframe: 360
TP1: 0.006588
Entry: 0.006413
STOP: 0.006238
Entry Conditions:
| Quick pump going not CPI data
| Alts unstable ahead of ETH Shanghai update - limited spot long opps.
| Massive volume
| Break of downtrend that dates back to late March

$FUN/#USDT [#FunFair]: Resistance_Breakout◳◱ A Resistance Breakout has been identified on the $FUN / $USDT chart. The price has broken above a key resistance level, indicating a potential bullish trend. The next resistance key levels are located at 0.00698 | 0.00728 | 0.00803, and the major support zones can be found at 0.00623 | 0.00578 | 0.00503. Consider entering at the current price zone of 0.00637 and targeting higher levels.
◰◲ General info :
▣ Name: FunFair
▣ Rank: 288
▣ Exchanges: Binance, Gateio, Hitbtc
▣ Category/Sector: Media and Entertainment - Gambling
▣ Overview: FunFair is building a decentralized casino platform for transparent and fair online gambling.
◰◲ Technical Metrics :
▣ Mrkt Price: 0.00637 ₮
▣ 24HVol: 1,332,473.771 ₮
▣ 24H Chng: 1.757%
▣ 7-Days Chng: -5.19%
▣ 1-Month Chng: -6.47%
▣ 3-Months Chng: -3.61%
◲◰ Pivot Points - Levels :
◥ Resistance: 0.00698 | 0.00728 | 0.00803
◢ Support: 0.00623 | 0.00578 | 0.00503
◱◳ Indicators recommendation :
▣ Oscillators: NEUTRAL
▣ Moving Averages: STRONG_SELL
◰◲ Technical Indicators Summary : SELL
◲◰ Sharpe Ratios :
▣ Last 30D: -1.45
▣ Last 90D: 0.11
▣ Last 1-Y: -1.06
▣ Last 3-Y: 0.62
◲◰ Volatility :
▣ Last 30D: 0.36
▣ Last 90D: 0.38
▣ Last 1-Y: 0.47
▣ Last 3-Y: 1.34
◳◰ Market Sentiment Index :
▣ News sentiment score is N/A
▣ Twitter sentiment score is 0.46 - Bearish
▣ Reddit sentiment score is 0.73 - Bullish
▣ In-depth FUNUSDT technical analysis on Tradingview TA page
▣ What do you think of this analysis? Share your insights and let's discuss in the comments below. Your like, follow and support would be greatly appreciated!
◲ Disclaimer
Please note that the information and publications provided are for informational purposes only and should not be construed as financial, investment, trading, or any other type of advice or recommendation. We encourage you to conduct your own research and consult with a qualified professional before making any financial decisions. The use of the information provided is solely at your own risk.
▣ Welcome to the home of charting big: TradingView
Benefit from a ton of financial analysis features, instruments and data. Have a look around, and if you do choose to go with an upgraded plan, you'll get up to $30.
Discover it here - affiliate link -

FUN trend indicates an uptrend forLike any investment, investing in FUN coin carries risks, and the decision to buy should be made after a thorough examination of the market and fundamental data on the coin. However, if the current market trend indicates an upward trend, it could be a favorable sign for investors.
In addition, FUN coin may require acceleration to achieve significant growth in the next 2-3 years. This may be related to various factors, including technical, fundamental, and marketing aspects.
If you decide to invest in FUN coin, it is necessary to monitor market conditions and conduct trading operations taking into account the risks. Additionally, it is recommended to use only those investment funds that you can afford to lose and not put all your savings at stake.

$FUN/#USDT [#FUNToken]: SuperTrend BBand_Breakout◳◱ We've detected both a Bollinger Band breakout and a Super Trend pattern on the $FUN / $USDT chart. Both indicators are signaling a bullish trend, with the Bollinger Band indicating a potential bullish trend as the price has moved outside of the upper band and the Super Trend showing a bullish trend. This is a stronger bullish signal as both indicators are aligned. It may be a good idea to consider buying at the current price zone and targeting higher levels. Our analysis indicates that the key resistance levels are at 0.0073 | 0.00785 | 0.00891 and the major support zones are at 0.00624 | 0.00573 | 0.00467. However, it is still important to consider other factors such as overall market conditions, and other technical indicators before making a trade decision.
◰◲ Technical Metrics :
▣ Mrkt Price: 0.00733 ₮
▣ 24HVol: 277,248.411 ₮
▣ 24hChng: 1.103%
◲◰ Pivot Points - Levels :
◥ Resistance: 0.0073 | 0.00785 | 0.00891
◢ Support: 0.00624 | 0.00573 | 0.00467
◱◳ Indicators recommendation :
▣ Oscillators: BUY
▣ Moving Averages: STRONG_BUY
◰◲ Technical Indicators Summary : BUY
◳◰ Market Sentiment Index :
▣ News sentiment score is N/A
▣ Twitter sentiment score is 0.55 - Bullish
▣ Reddit sentiment score is 0.28 - Very Bearish
▣ In-depth FUNUSDT technical analysis on Tradingview TA page
▣ What do you think of this analysis? Share your insights and let's discuss in the comments below. Your like, follow and support would be greatly appreciated!
▣ Welcome to the home of charting big: TradingView
Benefit from a ton of financial analysis features, instruments and data. Have a look around, and if you do choose to go with an upgraded plan, you'll get up to $30.
Discover it here
