NIKKEI - Wave 5 - Elliott Wave (V2)Flat Regular seem completed at 31830, could not break below 31792. Because of this, target is just like previous plan.
JPN225 trade ideas

Nikkei resistance has been clearly broken.NIK225 - 24h expiry
Our bespoke resistance of 32325 has been clearly broken.
Previous resistance at 32200 now becomes support.
Our short term bias remains positive.
There is no clear indication that the upward move is coming to an end.
We look to buy dips.
We look to Buy at 32251 (stop at 32071)
Our profit targets will be 32701 and 32801
Resistance: 32400 / 32600 / 32800
Support: 32200 / 32050 / 31900
Risk Disclaimer
The trade ideas beyond this page are for informational purposes only and do not constitute investment advice or a solicitation to trade. This information is provided by Signal Centre, a third-party unaffiliated with OANDA, and is intended for general circulation only. OANDA does not guarantee the accuracy of this information and assumes no responsibilities for the information provided by the third party. The information does not take into account the specific investment objectives, financial situation, or particular needs of any particular person. You should take into account your specific investment objectives, financial situation, and particular needs before making a commitment to trade, including seeking advice from an independent financial adviser regarding the suitability of the investment, under a separate engagement, as you deem fit.
You accept that you assume all risks in independently viewing the contents and selecting a chosen strategy.
Where the research is distributed in Singapore to a person who is not an Accredited Investor, Expert Investor or an Institutional Investor, Oanda Asia Pacific Pte Ltd (“OAP“) accepts legal responsibility for the contents of the report to such persons only to the extent required by law. Singapore customers should contact OAP at 6579 8289 for matters arising from, or in connection with, the information/research distributed.

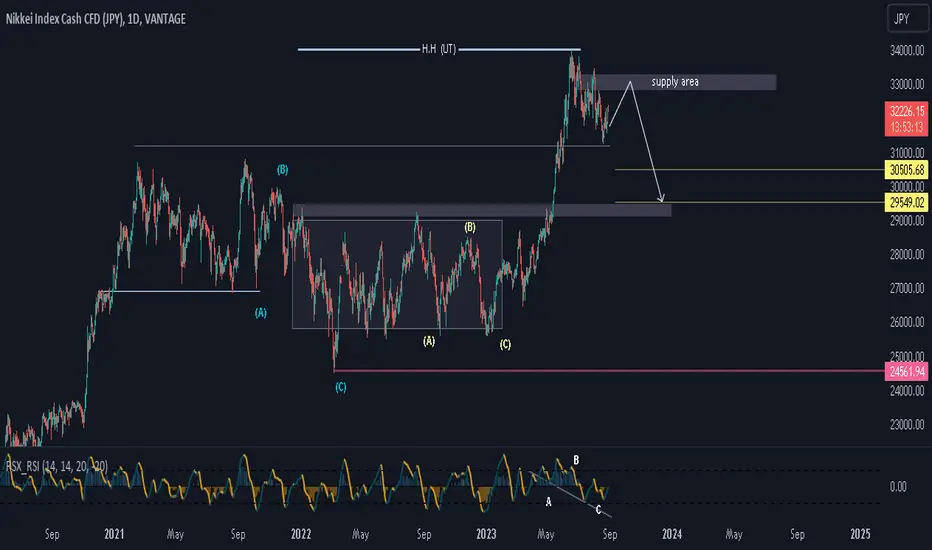
NIkkei Forecast | Up For A LHNikkei appears to be following a Wykoff schematic, pulling up into the supply area and falling to two price levels.
The completion of the fall will theoretically lead to a bull run that will potentially test the H.H. somewhere in the future, but for now, a bullish impulse is in play that might lead to a (desired) lower high.
Conclusion:
Short-term Bulls and Long-term bearish interests. Best followed on momentum indicators.
Happy trading,
K.
Nikkei 225 Long: Price Target 34370I've been a bear for a long time and my previous call for Nikkei was for a short. However, while price has indeed fallen, it did so in a corrective manner and I had to revisit my counts.
In this analysis, I've redrawn the wave 3 such that it reaches the recent peak and the corrective wave after that became wave 4.
I would expect first price target to be the same price distance as wave 1.

JP225 to continue in a rally?NIK225 - 24h expiry
Short term momentum is bullish.
There is no indication that the rally is coming to an end.
32240 has been pivotal.
A break of the recent high at 32240 should result in a further move higher.
The primary trend remains bullish.
We look to Buy a break of 32266 (stop at 32086)
Our profit targets will be 32716 and 32816
Resistance: 32240 / 32400 / 32600
Support: 32150 / 31900 / 31750
Risk Disclaimer
The trade ideas beyond this page are for informational purposes only and do not constitute investment advice or a solicitation to trade. This information is provided by Signal Centre, a third-party unaffiliated with OANDA, and is intended for general circulation only. OANDA does not guarantee the accuracy of this information and assumes no responsibilities for the information provided by the third party. The information does not take into account the specific investment objectives, financial situation, or particular needs of any particular person. You should take into account your specific investment objectives, financial situation, and particular needs before making a commitment to trade, including seeking advice from an independent financial adviser regarding the suitability of the investment, under a separate engagement, as you deem fit.
You accept that you assume all risks in independently viewing the contents and selecting a chosen strategy.
Where the research is distributed in Singapore to a person who is not an Accredited Investor, Expert Investor or an Institutional Investor, Oanda Asia Pacific Pte Ltd (“OAP“) accepts legal responsibility for the contents of the report to such persons only to the extent required by law. Singapore customers should contact OAP at 6579 8289 for matters arising from, or in connection with, the information/research distributed.

FALLING WEDGE with 4H HIDDEN BULL DIVCaught this FALLING WEDGE with 4H HIDDEN BULL DIV. If ur interested wait for a pullback as this trade might run to tap the top trendline. Goodluck!

Nikkei to see a temporary move higher?NIK225 - 24h expiry - We look to Sell at 32340 (stop at 32540)
Although the bulls are in control, the stalling positive momentum indicates a turnaround is possible.
This is negative for short term sentiment and we look to set shorts at good risk/reward levels for a further correction lower.
The hourly chart technicals suggests further upside before the downtrend returns.
We therefore, prefer to fade into the rally with a tight stop in anticipation of a move back lower.
Further downside is expected although we prefer to sell into rallies close to the 32340 level.
Our profit targets will be 31840 and 31740
Resistance: 34015 / 35000 / 36110
Support: 30800 / 29810 / 28815
Please be advised that the information presented on TradingView is provided to Vantage (‘Vantage Global Limited’, ‘we’) by a third-party provider (‘Everest Fortune Group’). Please be reminded that you are solely responsible for the trading decisions on your account. There is a very high degree of risk involved in trading. Any information and/or content is intended entirely for research, educational and informational purposes only and does not constitute investment or consultation advice or investment strategy. The information is not tailored to the investment needs of any specific person and therefore does not involve a consideration of any of the investment objectives, financial situation or needs of any viewer that may receive it. Kindly also note that past performance is not a reliable indicator of future results. Actual results may differ materially from those anticipated in forward-looking or past performance statements. We assume no liability as to the accuracy or completeness of any of the information and/or content provided herein and the Company cannot be held responsible for any omission, mistake nor for any loss or damage including without limitation to any loss of profit which may arise from reliance on any information supplied by Everest Fortune Group

JPN225 buy ideaThe area at 31964.5 was previously a very strong support and then price broke through and price is now testing the area as resistance but it does not seem like it hold back the bullish momentum

NIkkei 225 possible correction before continuation of downtrendBasis short term break of trendline, I assume the Nikkei 225 will proceed upwards to 31900, this is subject to the break above 31500

JPN225 ANALYSISThe move from Jan 23 has been impulsive by nature. The current correction is from June this year is corrective by nature and is taking a shape of a double zig-zag. The move up is expected to complete wave five targeting the 35171.09 market level @ which wave 1 will equal wave five. The market still remains the final arbiter.

Nikkei Long positionits looks that Nikkei at end of correction wave , it could bounce back any time soon ,
keep any aye on it, track it in STF for proper entry and Sl.

JPN225 Short Pivot: 31550.00
Our preference:
short positions below 31550.00 with targets at 31230.00 & 31000.00 in extension.
Alternative scenario:
above 31550.00 look for further upside with 31750.00 & 31910.00 as targets.
Comment:
a break below 31230.00 would trigger a drop towards 31000.00.


✅NIKKEI BEARISH BREAKOUT|SHORT🔥
✅NIKKEI was trading in an
Uptrend but now we are seeing
A bearish breakout of a strong
Horizontal support level of 32,000
So I think that the index will go down
SHORT🔥
✅Like and subscribe to never miss a new idea!✅

Buying Nikkei at pivotal swing low.NIK225 - 24h expiry - We look to Buy at 31770 (stop at 31475)
Although the bears are in control, the stalling negative momentum indicates a turnaround is possible.
We are trading at oversold extremes.
This is positive for short term sentiment and we look to set longs at good risk/reward levels for a further correction higher.
The hourly chart technicals suggests further downside before the uptrend returns.
Preferred trade is to buy on dips.
Our profit targets will be 32610 and 34015
Resistance: 34015 / 35000 / 36110
Support: 30800 / 29810 / 28815
Please be advised that the information presented on TradingView is provided to Vantage (‘Vantage Global Limited’, ‘we’) by a third-party provider (‘Everest Fortune Group’). Please be reminded that you are solely responsible for the trading decisions on your account. There is a very high degree of risk involved in trading. Any information and/or content is intended entirely for research, educational and informational purposes only and does not constitute investment or consultation advice or investment strategy. The information is not tailored to the investment needs of any specific person and therefore does not involve a consideration of any of the investment objectives, financial situation or needs of any viewer that may receive it. Kindly also note that past performance is not a reliable indicator of future results. Actual results may differ materially from those anticipated in forward-looking or past performance statements. We assume no liability as to the accuracy or completeness of any of the information and/or content provided herein and the Company cannot be held responsible for any omission, mistake nor for any loss or damage including without limitation to any loss of profit which may arise from reliance on any information supplied by Everest Fortune Group

bearish hchWe come from the break of a bearish hch with its respective pullback at the 32600 levels.
the visit to 32260 seems to be inevitable.
In that area we would look to buy to look for previous highs.

Stock Index Review...Key Levels you need to watch!!We take a look at the Daily charts and price action on our Key Indexes.
It is important to have a longer term view of the price action and risk levels on the key markets so we will discuss our major markets and what we are looking for in the video.
We take a look at the following Key Indexes:-
Nasdaq, DOW, DAX, FTSE, ASX200, Hang Seng and the Nikkei.
*** Feel free to take a look at our profile page and Please Follow for more content ***
*** Please Leave a Like and Comment if you enjoyed this video ***

Further upside is expected from Nikkei.NIK225 - 24h expiry - We look to Buy a break of 32430 (stop at 32190)
Selling posted in Asia.
Daily signals for sentiment are at oversold extremes.
This is positive for short term sentiment and we look to set longs at good risk/reward levels for a further correction higher.
Indecisive price action has resulted in sideways congestion on the intraday chart.
Further upside is expected, however, due to the strong resistance above we prefer to buy a break of 32430, which will confirm the bullish sentiment.
Our profit targets will be 33030 and 33150
Resistance: 34015 / 35000 / 36110
Support: 32030 / 30800 / 29810
Please be advised that the information presented on TradingView is provided to Vantage (‘Vantage Global Limited’, ‘we’) by a third-party provider (‘Everest Fortune Group’). Please be reminded that you are solely responsible for the trading decisions on your account. There is a very high degree of risk involved in trading. Any information and/or content is intended entirely for research, educational and informational purposes only and does not constitute investment or consultation advice or investment strategy. The information is not tailored to the investment needs of any specific person and therefore does not involve a consideration of any of the investment objectives, financial situation or needs of any viewer that may receive it. Kindly also note that past performance is not a reliable indicator of future results. Actual results may differ materially from those anticipated in forward-looking or past performance statements. We assume no liability as to the accuracy or completeness of any of the information and/or content provided herein and the Company cannot be held responsible for any omission, mistake nor for any loss or damage including without limitation to any loss of profit which may arise from reliance on any information supplied by Everest Fortune Group


Stock Index Review - Key Markets and levels to watchWe take a look at the Daily charts and price action on our Key Indexes.
It is important to have a longer term view of the price action and risk levels on the key markets so we will discuss our major markets and what we are looking for in the video.
We take a look at the following Key Indexes:-
SP500, Nasdaq, DOW, DAX, FTSE, ASX200, Hang Seng and the Nikkei.
*** Feel free to take a look at our profile page and Please Follow for more content ***
*** Pleas Leave a Like and Comment if you enjoyed this video ***

NIKKEI Uptrend And Support! Buy!
Hello,Traders!
NIKKEI is trading in an
Uptrend and trend is your
Friend so as the index
Is retesting a horizontal
Support of 32,000 I think
That we will see a local rebound
Buy!
Like, comment and subscribe to help us grow!
Check out other forecasts below too!

NI225 LONG FROM SUPPORTNI225 is going down now but a strong support level is ahead at 31,874 this I am expecting a rebound and a move up towards the target at 32.600.

✅NI225 LONG FROM SUPPORT🚀
✅NI225 is going down now
But a strong support level is ahead at 31,874
Thus I am expecting a rebound
And a move up towards the target at 32,600
LONG🚀
✅Like and subscribe to never miss a new idea!✅
