NI225: Strong Growth Ahead! Long!
My dear friends,
Today we will analyse NI225 together☺️
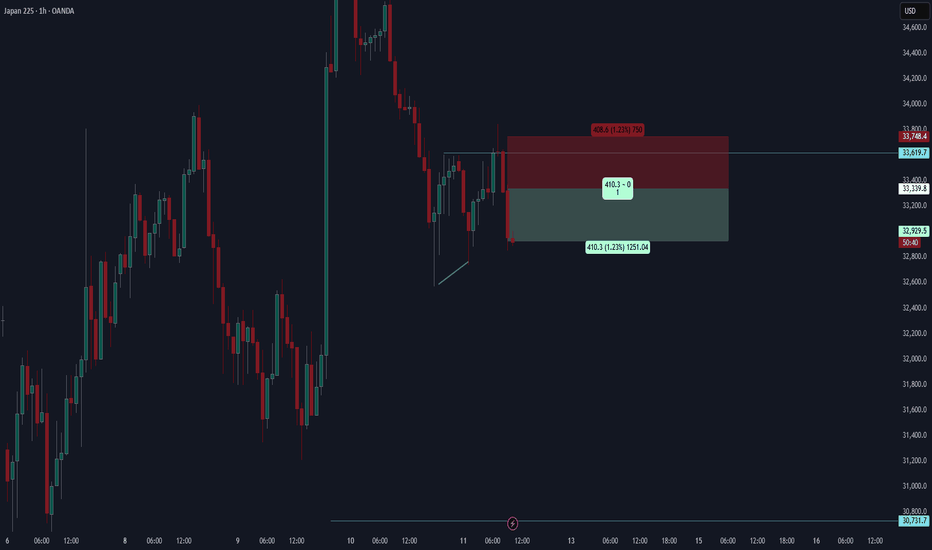
The market is at an inflection zone and price has now reached an area around 33.585.58 where previous reversals or breakouts have occurred.And a price reaction that we are seeing on multiple timeframes here could signal the next move down so we can enter on confirmation, and target the next key level of 34.793.45.Stop-loss is recommended beyond the inflection zone.
❤️Sending you lots of Love and Hugs❤️
JPN225 trade ideas
NIKKEI Long From A Massive Support! Buy!
Hello,Traders!
NIKKEI stock index has
Lost almost 27% from the ATH
Which means it is clearly oversold
And the index is about to retest
A massive horizontal support level
Of 30,000 which is a great spot
For going long on the index
And even if the support gets
Broken I would still hold the
Position expecting a rebound
Buy!
Comment and subscribe to help us grow!
Check out other forecasts below too!
Disclosure: I am part of Trade Nation's Influencer program and receive a monthly fee for using their TradingView charts in my analysis.
J225 Analysis📉 Japan’s Nikkei 225 has plunged sharply from its all-time high (ATH) at 42,530, recorded in July 2024, wiping out several months of gains. Price sliced through major support zones at 36,250, 33,817, and is now holding just above 30,373. 🩸
🔻 The sharp drop follows increased global risk-off sentiment, stronger Yen pressure, and Japan’s export concerns tied to U.S. tariff decisions. Investors are reacting to broader uncertainty and capital flow shifts. 🧾📉
🔑 Key Levels:
-Resistance: 33,817 ❌ | 36,250 ❌
-Support: 30,373 🛡
📈 Scenarios:
-Bullish: Bounce from 30,373 with strong volume could trigger a recovery wave. 📊
-Bearish: A clean break below 30,373 could lead to a deeper correction. 🚨
⚠️ Volatility Alert: Global macro events and U.S.–Japan trade developments could continue to drive sharp moves. Stay alert and manage risk accordingly. 🎯
📘 This is not financial advice. DYOR and trade safe!
"JP225/NIKKEI" Index CFD Market Heist Plan (Scalping/Day Trade)🌟Hi! Hola! Ola! Bonjour! Hallo! Marhaba!🌟
Dear Money Makers & Robbers, 🤑💰✈️
Based on 🔥Thief Trading style technical and fundamental analysis🔥, here is our master plan to heist the "JP225/NIKKEI" Index CFD Market. Please adhere to the strategy I've outlined in the chart, which emphasizes short entry. Our aim is the high-risk Green Zone. Risky level, oversold market, consolidation, trend reversal, trap at the level where traders and bullish robbers are stronger. 🏆💸Book Profits Be wealthy and safe trade.💪🏆🎉
Entry 📈 : "The vault is wide open! Swipe the Bearish loot at any price - the heist is on!
however I advise to Place sell limit orders within a 15 or 30 minute timeframe most nearest or swing, low or high level.
Stop Loss 🛑: (37600) Thief SL placed at the nearest / swing high level Using the 8H timeframe scalping / day trade basis.
SL is based on your risk of the trade, lot size and how many multiple orders you have to take.
Target 🎯: 34000
🧲Scalpers, take note 👀 : only scalp on the Short side. If you have a lot of money, you can go straight away; if not, you can join swing traders and carry out the robbery plan. Use trailing SL to safeguard your money 💰.
"JP225/NIKKEI" Index CFD Market Heist Plan (Scalping/Day Trade) is currently experiencing a bearishness,., driven by several key factors.
📰🗞️Get & Read the Fundamental, Macro Economics, COT Report, Geopolitical and News Analysis, Sentimental Outlook, Intermarket Analysis, Index-Specific Analysis, Positioning and future trend targets... go ahead to check 👉👉👉🔗
⚠️Trading Alert : News Releases and Position Management 📰 🗞️ 🚫🚏
As a reminder, news releases can have a significant impact on market prices and volatility. To minimize potential losses and protect your running positions,
we recommend the following:
Avoid taking new trades during news releases
Use trailing stop-loss orders to protect your running positions and lock in profits
💖Supporting our robbery plan 💥Hit the Boost Button💥 will enable us to effortlessly make and steal money 💰💵. Boost the strength of our robbery team. Every day in this market make money with ease by using the Thief Trading Style.🏆💪🤝❤️🎉🚀
I'll see you soon with another heist plan, so stay tuned 🤑🐱👤🤗🤩
NIKKEI Stock Chart Fibonacci Analysis 040525Trading Idea
1) Find a FIBO slingshot
2) Check FIBO 61.80% level
3) Entry Point > 33,314/61.80%
Chart time frame: C
A) 15 min(1W-3M)
B) 1 hr(3M-6M)
C) 4 hr(6M-1year)
D) 1 day(1-3years)
Stock progress: C
A) Keep rising over 61.80% resistance
B) 61.80% resistance
C) 61.80% support
D) Hit the bottom
E) Hit the top
Stocks rise as they rise from support and fall from resistance. Our goal is to find a low support point and enter. It can be referred to as buying at the pullback point. The pullback point can be found with a Fibonacci extension of 61.80%. This is a step to find entry level. 1) Find a triangle (Fibonacci Speed Fan Line) that connects the high (resistance) and low (support) points of the stock in progress, where it is continuously expressed as a Slingshot, 2) and create a Fibonacci extension level for the first rising wave from the start point of slingshot pattern.
When the current price goes over 61.80% level , that can be a good entry point, especially if the SMA 100 and 200 curves are gathered together at 61.80%, it is a very good entry point.
As a great help, tradingview provides these Fibonacci speed fan lines and extension levels with ease. So if you use the Fibonacci fan line, the extension level, and the SMA 100/200 curve well, you can find an entry point for the stock market. At least you have to enter at this low point to avoid trading failure, and if you are skilled at entering this low point, with fibonacci6180 technique, your reading skill to chart will be greatly improved.
If you want to do day trading, please set the time frame to 5 minutes or 15 minutes, and you will see many of the low point of rising stocks.
If want to prefer long term range trading, you can set the time frame to 1 hr or 1 day.
Nikkei 225 Wave Analysis – 4 April 2025
- Nikkei 225 broke support zone
- Likely to fall to support level 30600.00
The Nikkei 225 index recently broke the support zone located at the intersection of the support level 35000.00 (former monthly low from September) and the support trendline of the daily down channel from January.
The breakout of this support zone accelerated the active downward impulse wave 3 of the higher-order impulse wave (C) from January.
The Nikkei 225 index can be expected to fall to the next support level 30600.00 (former major support from August of 2024).
NIKKEI LONG FROM SUPPORT|
✅NIKKEI went down to retest a horizontal support of 35,250
Which makes me locally bullish biased
And I think that a move up
From the level is to be expected
Towards the target above at 36,093
LONG🚀
✅Like and subscribe to never miss a new idea!✅
Disclosure: I am part of Trade Nation's Influencer program and receive a monthly fee for using their TradingView charts in my analysis.
Japanese Stocks Slide on Trump Tariff FearsGlobal markets are on edge as Donald Trump’s looming tariff announcement sends shockwaves through Asian equities. Japanese stocks are leading the downturn, with the Nikkei 225 under heavy selling pressure as bearish momentum builds.
Tariff Fears Rock Japanese Markets
Asian markets started the week deep in the red as fears of a fresh wave of US tariffs took hold. Donald Trump’s comments over the weekend, hinting at broad-based reciprocal tariffs aimed at countries deemed to have unfair trade relationships with the US, sent investors running for cover. Japan, in particular, bore the brunt of the sell-off, with the benchmark Topix dropping 3.3% and the exporter-heavy Nikkei 225 sliding 3.9%.
Trump singled out Asia during his remarks, claiming the region had treated the US unfairly on trade. With the president set to unveil his tariff plans on April 2, the uncertainty is rattling global sentiment, especially given his framing of the date as a so-called “liberation day” for the US economy. Markets are bracing for the fallout, with Japanese stocks proving particularly vulnerable due to their heavy reliance on exports.
Nikkei 225: Bearish Momentum Building
The Nikkei 225 has had a rough start to the week, dropping over 6% in the past four sessions and breaking below key swing support, hitting levels last seen in September 2024. The broader market structure has been a sideways range since the highs of July 2024 and the spike lows of August 2024, but recent price action suggests the bearish bias is gaining traction.
One major red flag is the 50-day moving average crossing below the 200-day moving average—often dubbed the “death cross.” This technical signal indicates that the medium-term momentum has shifted to the downside. The RSI is also retesting its March lows without showing any divergence, reinforcing the bearish sentiment and suggesting that sellers are still in control.
Interestingly, the lack of volume behind the recent drop does raise some questions. Volume has been steadily declining since March, indicating that while prices are falling, the move lacks the conviction typical of a sustained downtrend. This divergence between price and volume suggests that the sell-off could be running out of steam, leaving the door open for a short-term rebound.
J225 Daily Candle Chart
Past performance is not a reliable indicator of future results
Drilling down to the hourly chart, the Nikkei 225’s downtrend looks increasingly aggressive. The index is tracking the 9 EMA lower, with the gap widening against the 21 EMA—highlighting the accelerating momentum. However, the RSI on this lower timeframe has dipped deep into oversold territory, hinting that a short-term pullback might be on the cards. We could see a retest of the recently broken daily swing support as bargain hunters potentially step in.
J225 Hourly Candle Chart
Past performance is not a reliable indicator of future results
Disclaimer: This is for information and learning purposes only. The information provided does not constitute investment advice nor take into account the individual financial circumstances or objectives of any investor. Any information that may be provided relating to past performance is not a reliable indicator of future results or performance. Social media channels are not relevant for UK residents.
Spread bets and CFDs are complex instruments and come with a high risk of losing money rapidly due to leverage. 83% of retail investor accounts lose money when trading spread bets and CFDs with this provider. You should consider whether you understand how spread bets and CFDs work and whether you can afford to take the high risk of losing your money.
short opportunity This is a very bearish chart. I missed to opened a short position so now I have to wait for the second chance.
I will open a short position if and when:
1. the price comes back up to fill the gap in the daily chart.
2. The price is going to roll back down at major fib level such as 0.618 and 0.5.
3. Momentum indicators in daily chart stay in the bear zone and roll down to the downside.
Nikkei 225 (existing short): Adjust your stop lossThis is the video update that I promised in my previous video. I have mentioned that when prices is reaching the personal target, I will update again.
So for those of you who are still holding a short position, and you want to hold on and see if this is gonna be a big ride down, my suggestion is to adjust your stop loss and maybe reduce you position (i.e. take some profits first).
How you want to manage this trade will be based on your personality and trading style. Good luck!
Japan225 to find buyers at market price?NIK225 - 24h expiry
Price action looks to be forming a bottom.
A Doji style candle has been posted from the base.
Short term bias is mildly bullish. Preferred trade is to buy on dips.
Weekly pivot is at 37485.
We look to Buy at 37485 (stop at 37131)
Our profit targets will be 38496 and 40675
Resistance: 38275 / 40675 / 42155
Support: 36790 / 35590 / 34390
Risk Disclaimer
The trade ideas beyond this page are for informational purposes only and do not constitute investment advice or a solicitation to trade. This information is provided by Signal Centre, a third-party unaffiliated with OANDA, and is intended for general circulation only. OANDA does not guarantee the accuracy of this information and assumes no responsibilities for the information provided by the third party. The information does not take into account the specific investment objectives, financial situation, or particular needs of any particular person. You should take into account your specific investment objectives, financial situation, and particular needs before making a commitment to trade, including seeking advice from an independent financial adviser regarding the suitability of the investment, under a separate engagement, as you deem fit.
You accept that you assume all risks in independently viewing the contents and selecting a chosen strategy.
Where the research is distributed in Singapore to a person who is not an Accredited Investor, Expert Investor or an Institutional Investor, Oanda Asia Pacific Pte Ltd (“OAP“) accepts legal responsibility for the contents of the report to such persons only to the extent required by law. Singapore customers should contact OAP at 6579 8289 for matters arising from, or in connection with, the information/research distributed.
A quick long on NikkeiWarning: This is a counter trend quick trade.
JPN is in a downtrend on Daily. H4 is flat.
After last night's sell off there will be some buyers in the market looking for a deal.
We are going long based on:
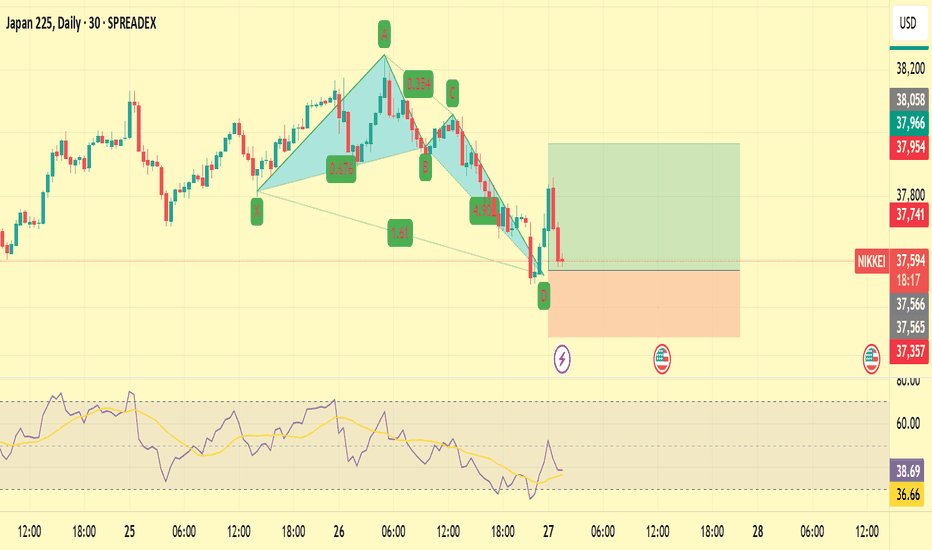
1) There is a crab pattern
2) RSI divergence on M15
3) Strong support at 37500 area
Stop loss is 200+ pips and target is 400.
Nikkei price action forming a top?JP225USD -24h expiry
Price action looks to be forming a top.
The primary trend remains bearish.
Preferred trade is to sell into rallies.
The hourly chart technicals suggests further upside before the downtrend returns.
We therefore, prefer to fade into the rally with a tight stop in anticipation of a move back lower.
We look to Sell at 38270 (stop at 38679)
Our profit targets will be 37247 and 36790
Resistance: 38275 / 40675 / 42155
Support: 36790 / 35590 / 34390
Risk Disclaimer
The trade ideas beyond this page are for informational purposes only and do not constitute investment advice or a solicitation to trade. This information is provided by Signal Centre, a third-party unaffiliated with OANDA, and is intended for general circulation only. OANDA does not guarantee the accuracy of this information and assumes no responsibilities for the information provided by the third party. The information does not take into account the specific investment objectives, financial situation, or particular needs of any particular person. You should take into account your specific investment objectives, financial situation, and particular needs before making a commitment to trade, including seeking advice from an independent financial adviser regarding the suitability of the investment, under a separate engagement, as you deem fit.
You accept that you assume all risks in independently viewing the contents and selecting a chosen strategy.
Where the research is distributed in Singapore to a person who is not an Accredited Investor, Expert Investor or an Institutional Investor, Oanda Asia Pacific Pte Ltd (“OAP“) accepts legal responsibility for the contents of the report to such persons only to the extent required by law. Singapore customers should contact OAP at 6579 8289 for matters arising from, or in connection with, the information/research distributed.


