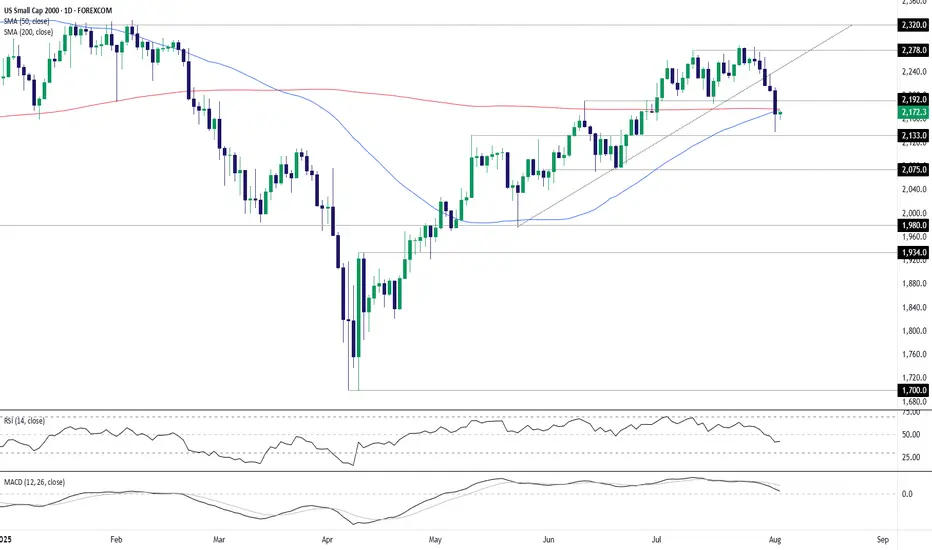
Small Caps: Rebound or rollover at 200DMA?Near-term price action in U.S. small-cap stocks may be instructive for assessing longer-term directional risks, with the contract trading near the key 200-day simple moving average.
Despite breaking uptrend support and extending the bearish move late last week, buying dips remains the preferred strategy unless there’s clear evidence the U.S. economy is sliding into recession—an outcome unlikely to be resolved near-term with only second-tier economic data on the calendar this week. That also means market pricing for just under 100 basis points of Fed rate cuts by mid-2026 is unlikely to shift dramatically, helping to support risk appetite.
If the contract can reclaim the 200DMA and hold there, longs could be initiated with a stop beneath the level for protection against reversal. 2192 is an early hurdle for bulls with a break of that level opening the door for a run towards 2240 or even 2278.
Alternatively, if the contract remains capped beneath the 200DMA, the setup could be flipped with shorts established below the level and a stop above. Friday’s low and 2133 are obvious near-term targets, with support at 2075 the next downside level after that.
Momentum indicators remain mixed despite rolling over in late July, placing more weight on price action rather than any firm directional bias.
Good luck!
DS
US2000 trade ideas
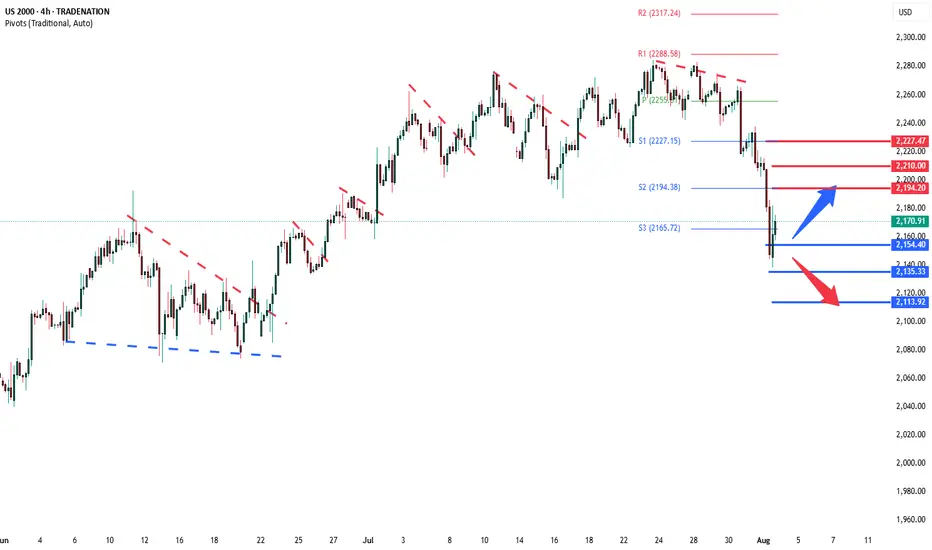
Russell2000 Key Trading levelsKey Support and Resistance Levels
Resistance Level 1: 2194
Resistance Level 2: 2210
Resistance Level 3: 2227
Support Level 1: 2154
Support Level 2: 2135
Support Level 3: 2113
This communication is for informational purposes only and should not be viewed as any form of recommendation as to a particular course of action or as investment advice. It is not intended as an offer or solicitation for the purchase or sale of any financial instrument or as an official confirmation of any transaction. Opinions, estimates and assumptions expressed herein are made as of the date of this communication and are subject to change without notice. This communication has been prepared based upon information, including market prices, data and other information, believed to be reliable; however, Trade Nation does not warrant its completeness or accuracy. All market prices and market data contained in or attached to this communication are indicative and subject to change without notice.
"US2000 THIEF TRADE: SWIPE & ESCAPE BEFORE BEARS!"🚨Russell 2000 Robbery: Pullback to Power Play⚡️💰
🌟Hi! Hola! Ola! Bonjour! Hallo! Marhaba!🌟
Dear Market Robbers & Money Makers, 🤑💰💸✈️
This is a full-blown heist plan on the US2000 (Russell 2000) index using the Thief Trading Style™, a perfect combo of real-time technicals + macro heat.
Get ready to swipe the bull run right after a tactical pullback — let’s rob the market clean and vanish at the high-voltage resistance level ⚡️🚨📊
📈 Entry Plan – The Vault Opens @ 2190.00
Watch for a clean pullback to the zone around 2190.00.
Place buy limit orders after confirmation from 15m or 30m candles – preferably near recent swing lows.
Smart move: Set alerts so you don’t miss the breakout trigger.
🛑 Stop Loss – Escape Hatch @ 2140.00
Use the nearest 4H candle wick or swing low as your SL level.
Thieves scale their lot size & SL based on position stacking and trade confidence.
🎯 Target – 2380.00 (Or Jump Before the Heat Gets Real)
Take profit near the heavy resistance zone. Don’t overstay — market traps ahead! Electric reversals & institutional bears wait there to flip the game ⚡🐻
👀 Scalpers’ Secret:
Only long scalps! 💣
No funds? Follow the swing robbers.
Trail your SL and let the bulls push your bags up.
🧠 What’s Fueling This Bullish Ride?
US2000 is surging with:
• Risk appetite from macro sentiment
• COT data aligning bullish
• Intermarket signals syncing up
• Rotational flows into small-cap strength
⚠️ Thief Trading Alerts – News Impact Zone Incoming!
• Don’t enter fresh trades during red news.
• Use trailing SLs to guard floating profits.
Market spikes are good — if you’re prepared.
💣💥This isn’t just a trade – it’s a mission.
Rob smart, trail hard, and cash out sharp.
📦💼Every move is calculated. Every entry is a chance.
🚀Stay sharp, robbers – next heist plan drops soon! 💼🔐📈
🏆Trade like a thief, win like a boss.
Russell 2000 Bullish Attack – Vault Break-In Loading🚨US2000 / Russell 2000 Heist Plan – Bullish Loot Incoming!🚨
🤑 Dear Robbers of the Market Vault,
The Russell 2000 is showing cracks in the bear walls—time for a bold bullish break-in! 🔓📈
The Thief has eyes everywhere, and right now, the loot sits between 2140.0 & 2320.0. Let's steal it!
📌 Asset: US2000 / Russell 2000
📍 Plan: Bullish (Heist Mode: ON)
🧲 Method: Layering entries like a smooth criminal 🎯💣
💵 Entry: Any price – the vault door’s open, rob at your timing!
🛡️ Stop Loss: 2140.0 (Guarded exit in case the heat gets too strong)
🎯 Target: 2320.0 (The gold bars are stacked here)
🧠 Robbery Blueprint (Strategy Notes):
Use multiple buy limit orders 🔄
Structure entries near swing lows in 15m/30m charts
Wait for dips, snatch the momentum—we rob during weakness!
Always place alerts to spot intraday cracks in the defense lines 📳📊
Don’t chase; we trap the trap!
💥Risk Alert & Protection Plan:
News events = 🔥 volatility bombs.
❌ No fresh trades during high-impact news
✅ Use trailing SL to lock in the loot
🔐 Protect your gains like the vault guards protect gold!
⚔️ Scalpers & Swing Thieves Note:
Scalp only on the long side
💸 Small capital = DCA entry + trail
💰 Big pockets = Straight breakout sniper shot
Stay light, stay fast, stay rich!
📢 Final Words from the Mastermind:
Boost this heist if you love the thrill of the steal 💥
Trade with precision, exit with profits, and never let the market catch you!
The next robbery plan drops soon... be ready, robbers 🐱👤🚨📈
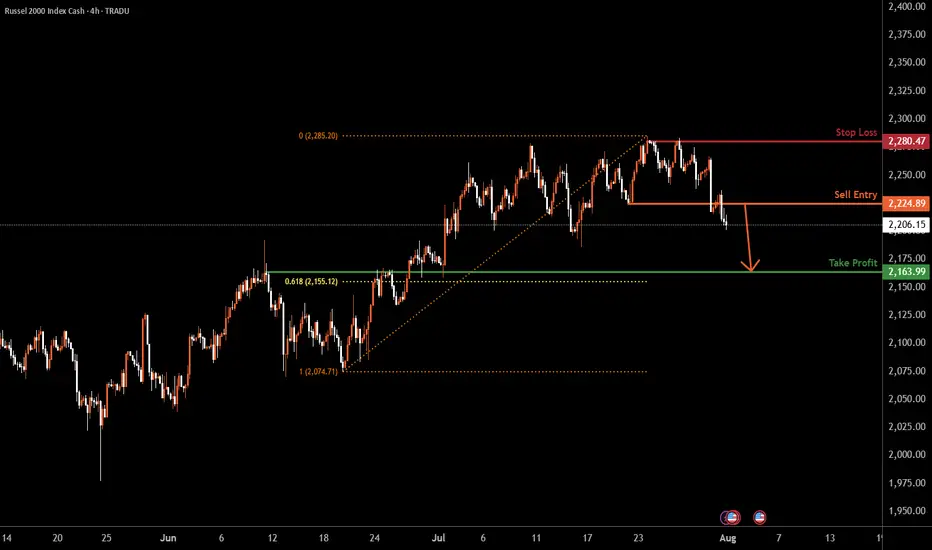
US2000 H4 | Bearish dropBased on the H4 chart analysis, we could see the price drop lower from the sell entry to the downside.
Sell entry is at 2,224.89, which is a pullback resistance.
Stop loss is at 2,280.47, a swing high resistance.
Take profit is at 2,163.99, which is an overlap support that is slightly above the 61.8% Fibonacci retracement.
High Risk Investment Warning
Trading Forex/CFDs on margin carries a high level of risk and may not be suitable for all investors. Leverage can work against you.
Stratos Markets Limited (tradu.com ):
CFDs are complex instruments and come with a high risk of losing money rapidly due to leverage. 65% of retail investor accounts lose money when trading CFDs with this provider. You should consider whether you understand how CFDs work and whether you can afford to take the high risk of losing your money.
Stratos Europe Ltd (tradu.com ):
CFDs are complex instruments and come with a high risk of losing money rapidly due to leverage. 66% of retail investor accounts lose money when trading CFDs with this provider. You should consider whether you understand how CFDs work and whether you can afford to take the high risk of losing your money.
Stratos Global LLC (tradu.com ):
Losses can exceed deposits.
Please be advised that the information presented on TradingView is provided to Tradu (‘Company’, ‘we’) by a third-party provider (‘TFA Global Pte Ltd’). Please be reminded that you are solely responsible for the trading decisions on your account. There is a very high degree of risk involved in trading. Any information and/or content is intended entirely for research, educational and informational purposes only and does not constitute investment or consultation advice or investment strategy. The information is not tailored to the investment needs of any specific person and therefore does not involve a consideration of any of the investment objectives, financial situation or needs of any viewer that may receive it. Kindly also note that past performance is not a reliable indicator of future results. Actual results may differ materially from those anticipated in forward-looking or past performance statements. We assume no liability as to the accuracy or completeness of any of the information and/or content provided herein and the Company cannot be held responsible for any omission, mistake nor for any loss or damage including without limitation to any loss of profit which may arise from reliance on any information supplied by TFA Global Pte Ltd.
The speaker(s) is neither an employee, agent nor representative of Tradu and is therefore acting independently. The opinions given are their own, constitute general market commentary, and do not constitute the opinion or advice of Tradu or any form of personal or investment advice. Tradu neither endorses nor guarantees offerings of third-party speakers, nor is Tradu responsible for the content, veracity or opinions of third-party speakers, presenters or participants.
RUT Echoes IWM – The Livermore Playbook?The Russell 2000 (RUT) is painting a structure that mirrors the IWM ETF – a widening accumulation channel, setting up for a potential breakout. The VolanX protocol flags this as a classic Livermore Speculative Chart pattern, where phases of quiet accumulation lead to an explosive markup.
Channel Support: ~2,245 is holding as the battleground for bulls.
Short-Term Projection: Expect a possible ping-pong move between 2,260 – 2,300 before the real momentum ignites.
Breakout Level: Above 2,310, the price could rip toward 2,390–2,400 (Livermore’s “point 10” territory).
VolanX suggests that this structure is not random – IWM and RUT are moving in tandem, with mid-cap risk appetite quietly building. If liquidity inflows continue, this setup could fuel a sharp vertical rally into August.
"Are you seeing the same Livermore-style accumulation in IWM as VolanX does?"
#RUT #IWM #VolanX #Livermore #Accumulation #BreakoutWatch #TradingView

U.S. Small Caps Break Out: Dash for Trash Gathers SteamSitting in an obvious uptrend with momentum indicators skewing increasingly bullish, it looks like the U.S. small cap 2000 contract wants to go higher. The dash for trash is on!
Having just cleared the July 10 high of 2278, it’s provided a decent setup to initiate fresh longs, allowing for a stop beneath that level for protection against a reversal.
2320 screens as an initial target given the contract consistently struggled to break above it earlier this year. Beyond that, 2375 and the record high of 2468 are the levels to watch.
Good luck!
DS

Russell2000 Key Trading LevelsKey Support and Resistance Levels
Resistance Level 1: 2256
Resistance Level 2: 2273
Resistance Level 3: 2282
Support Level 1: 2200
Support Level 2: 2177
Support Level 3: 2140
This communication is for informational purposes only and should not be viewed as any form of recommendation as to a particular course of action or as investment advice. It is not intended as an offer or solicitation for the purchase or sale of any financial instrument or as an official confirmation of any transaction. Opinions, estimates and assumptions expressed herein are made as of the date of this communication and are subject to change without notice. This communication has been prepared based upon information, including market prices, data and other information, believed to be reliable; however, Trade Nation does not warrant its completeness or accuracy. All market prices and market data contained in or attached to this communication are indicative and subject to change without notice.
Russell2000 Key Trading LevelsKey Support and Resistance Levels
Resistance Level 1: 2194
Resistance Level 2: 2210
Resistance Level 3: 2227
Support Level 1: 2154
Support Level 2: 2135
Support Level 3: 2113
This communication is for informational purposes only and should not be viewed as any form of recommendation as to a particular course of action or as investment advice. It is not intended as an offer or solicitation for the purchase or sale of any financial instrument or as an official confirmation of any transaction. Opinions, estimates and assumptions expressed herein are made as of the date of this communication and are subject to change without notice. This communication has been prepared based upon information, including market prices, data and other information, believed to be reliable; however, Trade Nation does not warrant its completeness or accuracy. All market prices and market data contained in or attached to this communication are indicative and subject to change without notice.

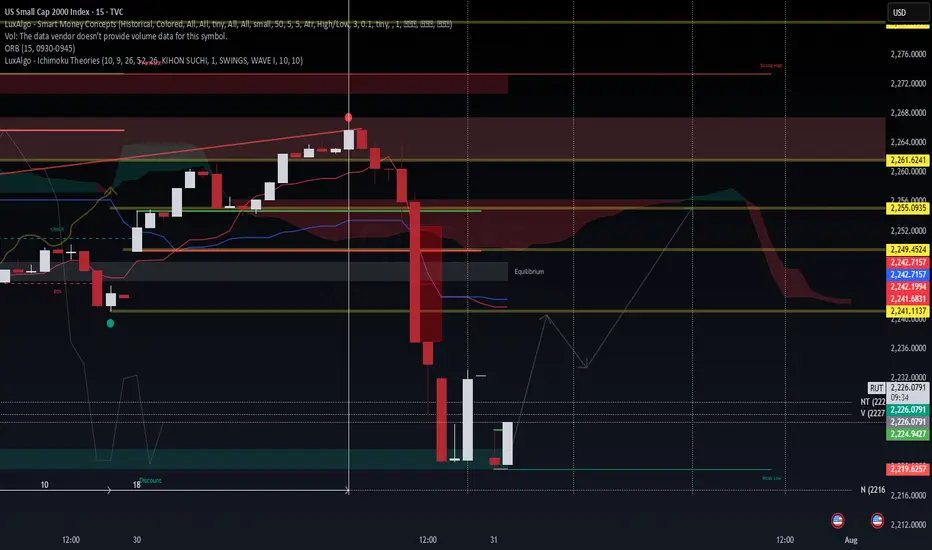
$RUT 15m – Liquidity Sweep + Discount Zone Reaction📉 TVC:RUT 15m – Liquidity Sweep + Discount Zone Reaction
WaverVanir DSS | July 31, 2025
The Russell 2000 just executed a sharp breakdown beneath equilibrium, tapping into our predefined discount zone and weak low near 2,219.62.
🧠 Smart Money Concepts Observed:
BOS (Break of Structure) confirmed → bearish control
Liquidity sweep through prior lows with wick rejection
Rejection forming inside key discount zone = potential demand reaction
Equilibrium now serves as upside magnet (reversion target: ~2,242–2,249)
🔮 VolanX Protocol Forecast:
Scenario A:
Price bounces off 2,219–2,221 zone, retests 2,242.71, and rejects at VWAP/Ichimoku cloud.
Scenario B:
Clean reclaim of 2,242 zone triggers reversion toward 2,255–2,261, but that requires volume conviction.
🚫 Invalidation: Acceptance below 2,219.62 = expansion lower toward 2,212.
⚠️ No volume data on this chart — trade with confirmation from correlated ETFs (IWM) or futures (RTY).
🛡️ VolanX DSS signal only. For educational purposes. Not financial advice.
#SMC #RUT #Russell2000 #SmartMoney #VolanX #WaverVanir #LiquidityHunt #OptionsFlow #MacroTech
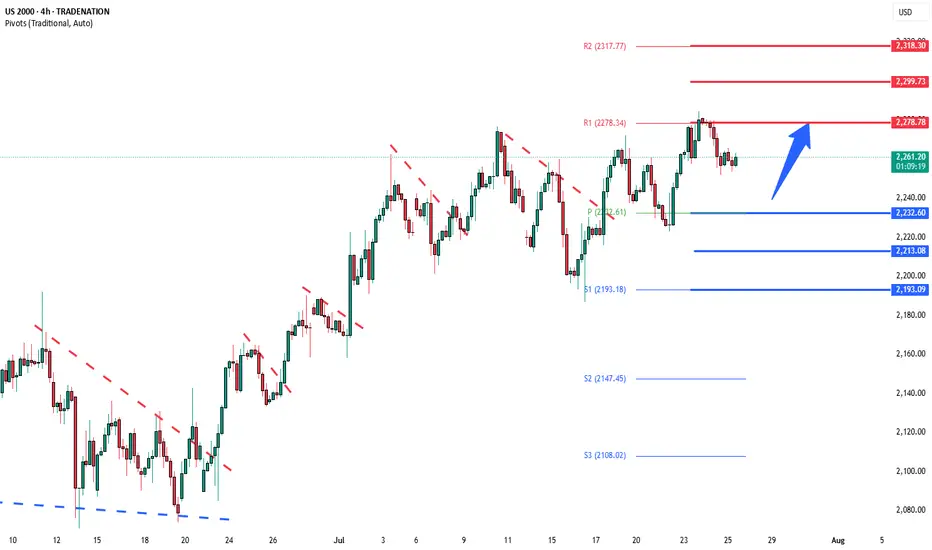
Russell2000 sideways consolidation supported at 2232Key Support and Resistance Levels
Resistance Level 1: 2278
Resistance Level 2: 2300
Resistance Level 3: 2318
Support Level 1: 2232
Support Level 2: 2213
Support Level 3: 2193
This communication is for informational purposes only and should not be viewed as any form of recommendation as to a particular course of action or as investment advice. It is not intended as an offer or solicitation for the purchase or sale of any financial instrument or as an official confirmation of any transaction. Opinions, estimates and assumptions expressed herein are made as of the date of this communication and are subject to change without notice. This communication has been prepared based upon information, including market prices, data and other information, believed to be reliable; however, Trade Nation does not warrant its completeness or accuracy. All market prices and market data contained in or attached to this communication are indicative and subject to change without notice.
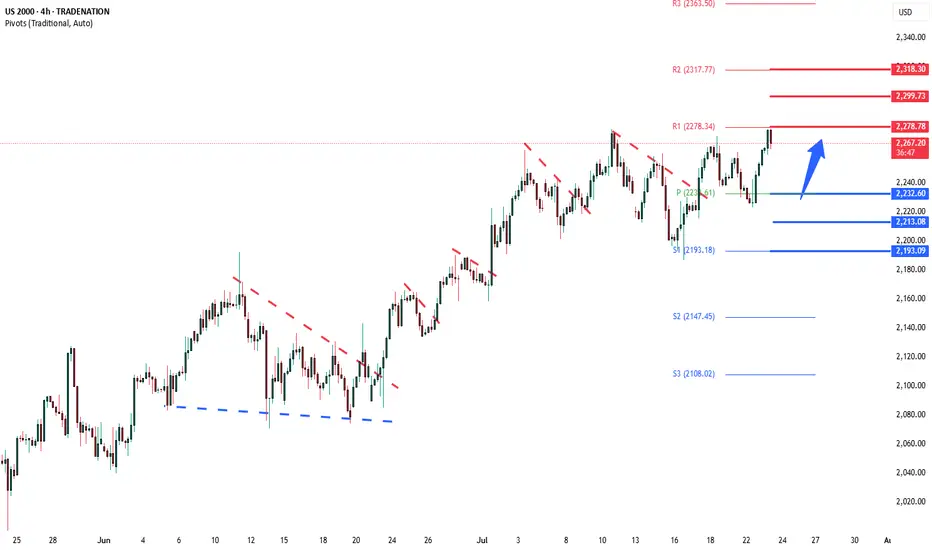
US2000--LONG--27_07_25-- Bullish trend continuation
--ascending channel
--Buy around 2249--2272
--TP around 2451
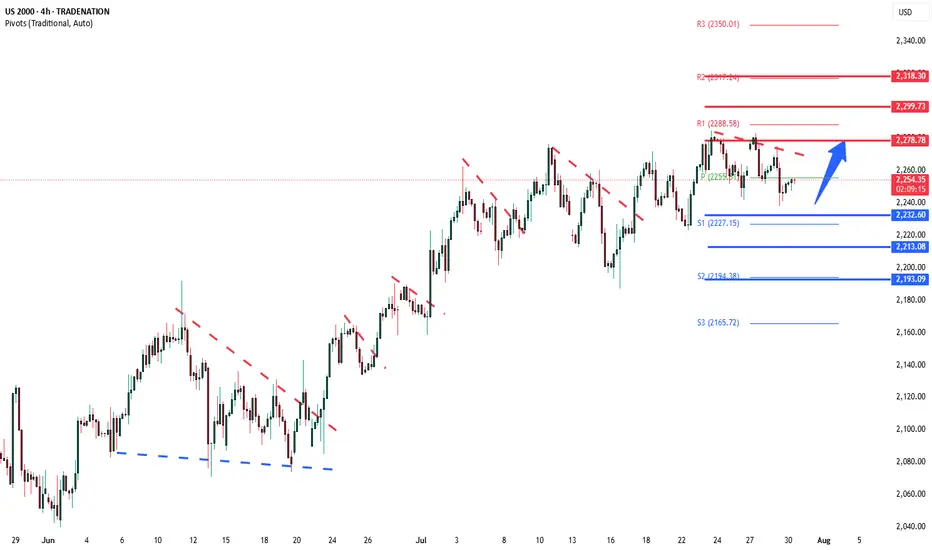
Russell2000 Bullish continuation supported at 2232.60Key Support and Resistance Levels
Resistance Level 1: 2278.80
Resistance Level 2: 2299.70
Resistance Level 3: 2318.30
Support Level 1: 2232.60
Support Level 2: 2213.00
Support Level 3: 2193.00
This communication is for informational purposes only and should not be viewed as any form of recommendation as to a particular course of action or as investment advice. It is not intended as an offer or solicitation for the purchase or sale of any financial instrument or as an official confirmation of any transaction. Opinions, estimates and assumptions expressed herein are made as of the date of this communication and are subject to change without notice. This communication has been prepared based upon information, including market prices, data and other information, believed to be reliable; however, Trade Nation does not warrant its completeness or accuracy. All market prices and market data contained in or attached to this communication are indicative and subject to change without notice.
Russell2000 bullish continuation breakoutKey Support and Resistance Levels
Resistance Level 1: 2278.80
Resistance Level 2: 2299.70
Resistance Level 3: 2318.30
Support Level 1: 2232.60
Support Level 2: 2213.00
Support Level 3: 2193.00
This communication is for informational purposes only and should not be viewed as any form of recommendation as to a particular course of action or as investment advice. It is not intended as an offer or solicitation for the purchase or sale of any financial instrument or as an official confirmation of any transaction. Opinions, estimates and assumptions expressed herein are made as of the date of this communication and are subject to change without notice. This communication has been prepared based upon information, including market prices, data and other information, believed to be reliable; however, Trade Nation does not warrant its completeness or accuracy. All market prices and market data contained in or attached to this communication are indicative and subject to change without notice.
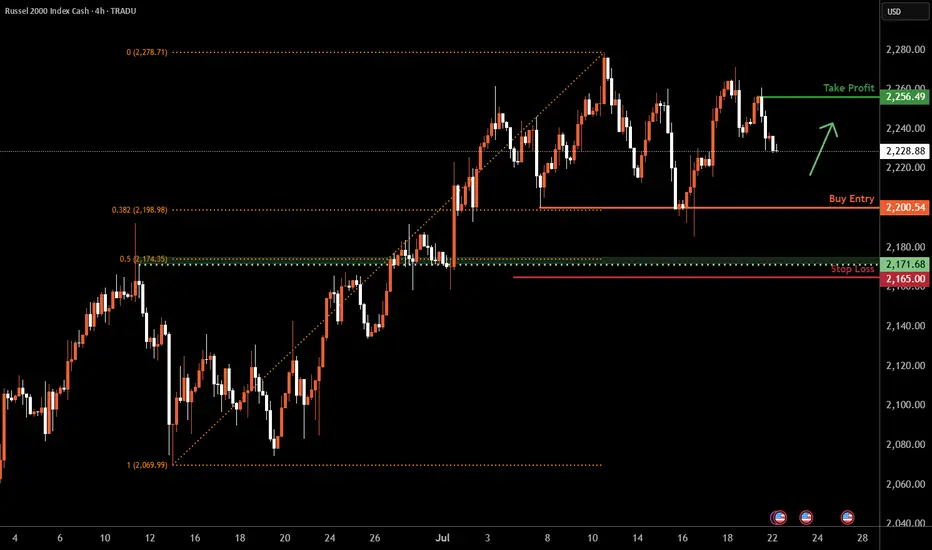
Russell 2000 H4 | Falling toward a multi-swing-low supportThe Russell 2000 (US2000) is falling towards a multi-swing-low support and could potentially bounce off this level to climb higher.
Buy entry is at 2,200.54 which is a multi-swing-low support that aligns with the 38.2% Fibonacci retracement.
Stop loss is at 2,165.00 which is a level that lies underneath an overlap support and the 50% Fibonacci retracement.
Take profit is at 2,256.49 which is a swing-high resistance.
High Risk Investment Warning
Trading Forex/CFDs on margin carries a high level of risk and may not be suitable for all investors. Leverage can work against you.
Stratos Markets Limited (tradu.com ):
CFDs are complex instruments and come with a high risk of losing money rapidly due to leverage. 66% of retail investor accounts lose money when trading CFDs with this provider. You should consider whether you understand how CFDs work and whether you can afford to take the high risk of losing your money.
Stratos Europe Ltd (tradu.com ):
CFDs are complex instruments and come with a high risk of losing money rapidly due to leverage. 66% of retail investor accounts lose money when trading CFDs with this provider. You should consider whether you understand how CFDs work and whether you can afford to take the high risk of losing your money.
Stratos Global LLC (tradu.com ):
Losses can exceed deposits.
Please be advised that the information presented on TradingView is provided to Tradu (‘Company’, ‘we’) by a third-party provider (‘TFA Global Pte Ltd’). Please be reminded that you are solely responsible for the trading decisions on your account. There is a very high degree of risk involved in trading. Any information and/or content is intended entirely for research, educational and informational purposes only and does not constitute investment or consultation advice or investment strategy. The information is not tailored to the investment needs of any specific person and therefore does not involve a consideration of any of the investment objectives, financial situation or needs of any viewer that may receive it. Kindly also note that past performance is not a reliable indicator of future results. Actual results may differ materially from those anticipated in forward-looking or past performance statements. We assume no liability as to the accuracy or completeness of any of the information and/or content provided herein and the Company cannot be held responsible for any omission, mistake nor for any loss or damage including without limitation to any loss of profit which may arise from reliance on any information supplied by TFA Global Pte Ltd.
The speaker(s) is neither an employee, agent nor representative of Tradu and is therefore acting independently. The opinions given are their own, constitute general market commentary, and do not constitute the opinion or advice of Tradu or any form of personal or investment advice. Tradu neither endorses nor guarantees offerings of third-party speakers, nor is Tradu responsible for the content, veracity or opinions of third-party speakers, presenters or participants.
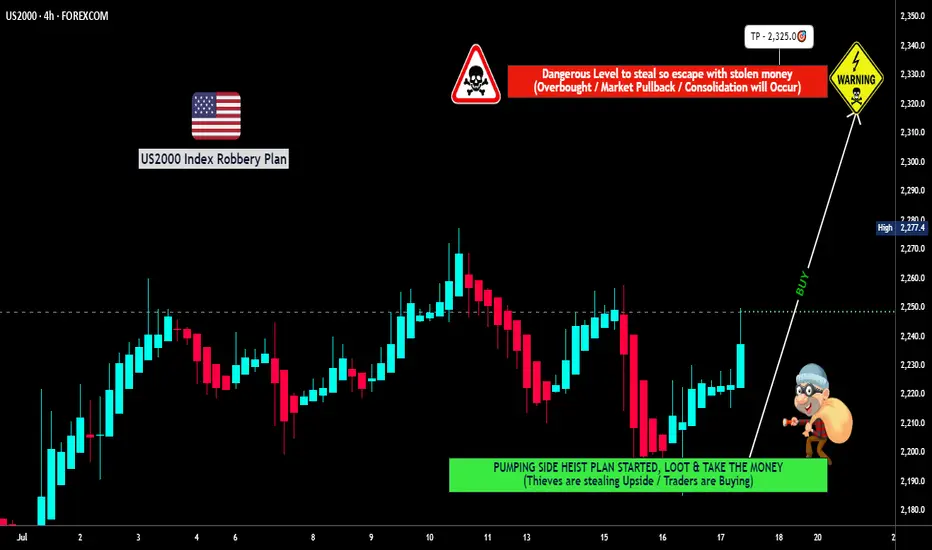
"US2000 THIEF TRADE: SWIPE & ESCAPE BEFORE BEARS!"🔥💰 "RUSSELL 2000 HEIST" – THIEF TRADING STYLE (BULLISH LOOTING IN PROGRESS!) 💰🔥
🚨 ATTENTION, MARKET ROBBERS & MONEY MAKERS! 🚨
(Thief Trading Strategy – High-Reward, Low-Risk Escape Plan!)
🎯 MISSION: US2000 / RUSSELL 2000 INDEX
(Current Market Status: Bullish Heist in Progress!)
🔓 ENTRY POINT: "THE VAULT IS OPEN!"
"SWIPE THE BULLISH LOOT AT ANY PRICE!" 🏦💨
Pro Thief Move: Use Buy Limit Orders (15-30min TF) near recent swing lows/highs for sneaky pullback entries.
Advanced Heist Tactics: Layered DCA entries (multiple limit orders) for maximum stealth & profit.
🛑 STOP-LOSS (ESCAPE ROUTE):
SL @ Nearest Swing Low (4H TF – 2200.0)
Risk Management Tip: Adjust SL based on your loot size (position sizing) & number of orders.
🏴☠️ TARGET: 2325.0 (OR ESCAPE BEFORE THE BEARS CATCH YOU!)
Scalpers Alert! 🚨 Only LONG-side scalp – if you’re rich, go all-in. If not, join the swing heist & use Trailing SL to lock profits!
💥 WHY THIS HEIST WILL WORK:
✔ Bullish Momentum Fueling the Rally
✔ Weak Bears Trapped Near Resistance
✔ Smart Money Accumulating Before Breakout
✔ Institutional Flow & Macro Trends Aligned (Check COT Report & News!)
📰 THIEF’S NEWS ALERT:
🚨 Beware of High-Impact News! (Avoid new trades during volatility.)
🚨 Use Trailing SL to Protect Your Loot!
💖 SUPPORT THE HEIST SQUAD!
👉 SMASH THAT "LIKE" & "BOOST" BUTTON! 👈
(More heists = More profits for all!)
🎭 DISCLAIMER:
This is NOT financial advice – just a Thief Trading Strategy! Trade at your own risk. Market conditions change fast, so stay sharp!
🚀 NEXT HEIST COMING SOON… STAY TUNED, ROBBERS! 🤑
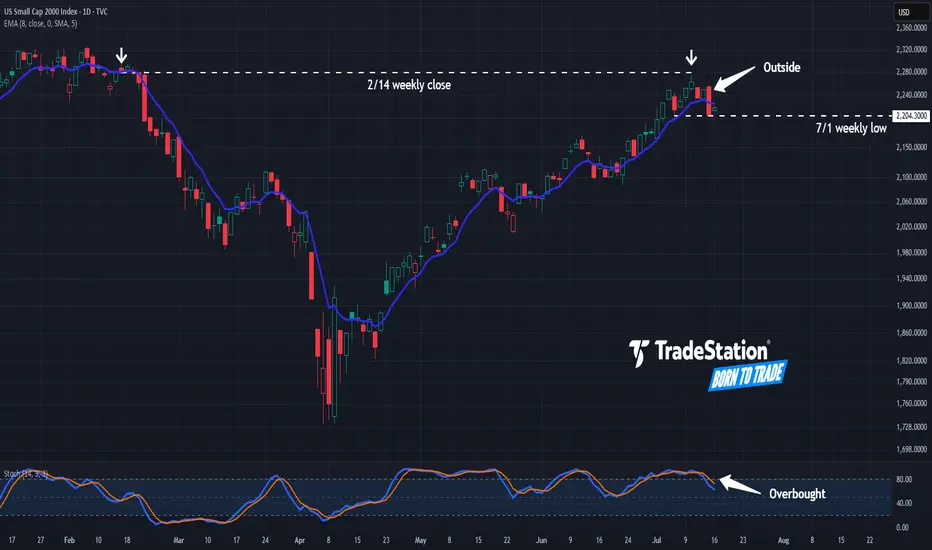
Have Small Caps Hit a Wall?The Russell 2000 has lagged the broader market for years, and now some traders may think it’s stalling again.
The first pattern on today’s chart is the February 14 weekly close of 2,280. The small cap index approached that level last Thursday but couldn’t hold. The resulting “shooting star” candlestick pattern, near a weekly level, may confirm that old resistance remains in place.
Second, RUT made a higher high yesterday and a lower low. That kind of bearish outside day is a potential reversal pattern.
Third, prices returned to a weekly low from July 1. Crossing below it could suggest support is breaking.
Fourth, stochastics are dipping from an overbought condition.
Finally, small caps are sensitive to borrowing costs. The 10-year Treasury yield has been making higher highs and higher lows on its weekly chart. Could further upside keep weighing on small caps?
TradeStation has, for decades, advanced the trading industry, providing access to stocks, options and futures. If you're born to trade, we could be for you. See our Overview for more.
Past performance, whether actual or indicated by historical tests of strategies, is no guarantee of future performance or success. There is a possibility that you may sustain a loss equal to or greater than your entire investment regardless of which asset class you trade (equities, options or futures); therefore, you should not invest or risk money that you cannot afford to lose. Online trading is not suitable for all investors. View the document titled Characteristics and Risks of Standardized Options at www.TradeStation.com . Before trading any asset class, customers must read the relevant risk disclosure statements on www.TradeStation.com . System access and trade placement and execution may be delayed or fail due to market volatility and volume, quote delays, system and software errors, Internet traffic, outages and other factors.
Securities and futures trading is offered to self-directed customers by TradeStation Securities, Inc., a broker-dealer registered with the Securities and Exchange Commission and a futures commission merchant licensed with the Commodity Futures Trading Commission). TradeStation Securities is a member of the Financial Industry Regulatory Authority, the National Futures Association, and a number of exchanges.
TradeStation Securities, Inc. and TradeStation Technologies, Inc. are each wholly owned subsidiaries of TradeStation Group, Inc., both operating, and providing products and services, under the TradeStation brand and trademark. When applying for, or purchasing, accounts, subscriptions, products and services, it is important that you know which company you will be dealing with. Visit www.TradeStation.com for further important information explaining what this means.
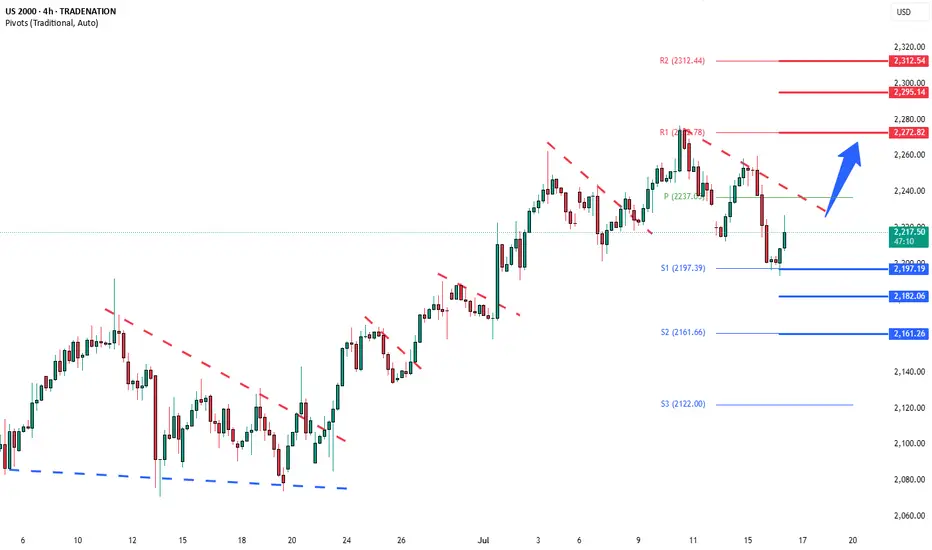
Russell2000 corrective pullback supported at 2197Key Support and Resistance Levels
Resistance Level 1: 2270
Resistance Level 2: 2295
Resistance Level 3: 2313
Support Level 1: 2197
Support Level 2: 2180
Support Level 3: 2160
This communication is for informational purposes only and should not be viewed as any form of recommendation as to a particular course of action or as investment advice. It is not intended as an offer or solicitation for the purchase or sale of any financial instrument or as an official confirmation of any transaction. Opinions, estimates and assumptions expressed herein are made as of the date of this communication and are subject to change without notice. This communication has been prepared based upon information, including market prices, data and other information, believed to be reliable; however, Trade Nation does not warrant its completeness or accuracy. All market prices and market data contained in or attached to this communication are indicative and subject to change without notice.
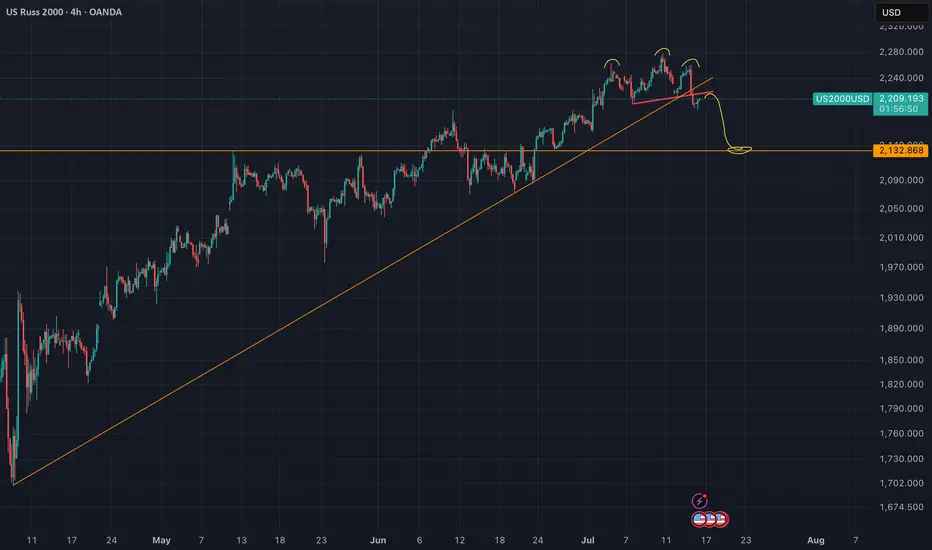
US2000 - Head And Shoulders (Top signal)Reversal in play. The neckline of the H&S got validated yesterday.
Nothing here should be interpreted as financial advise. Always do your own research and decisions.
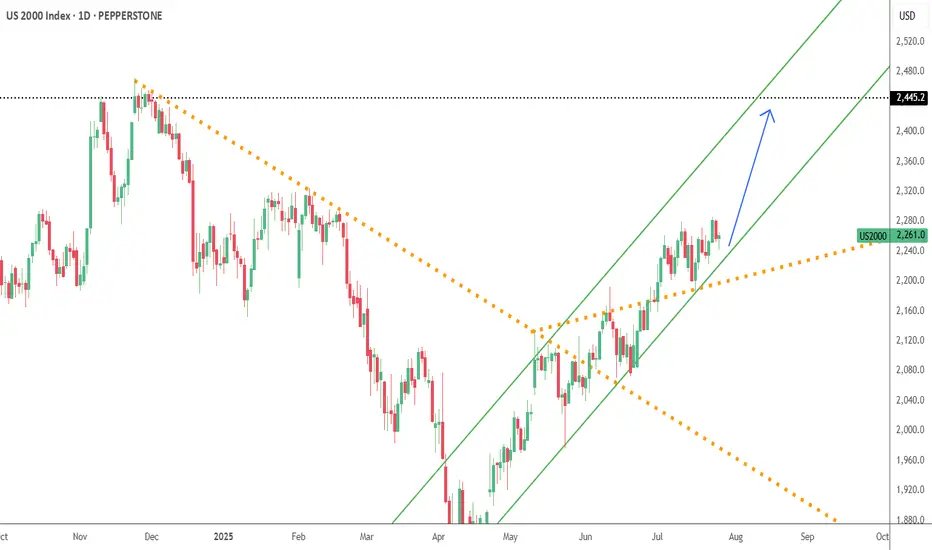
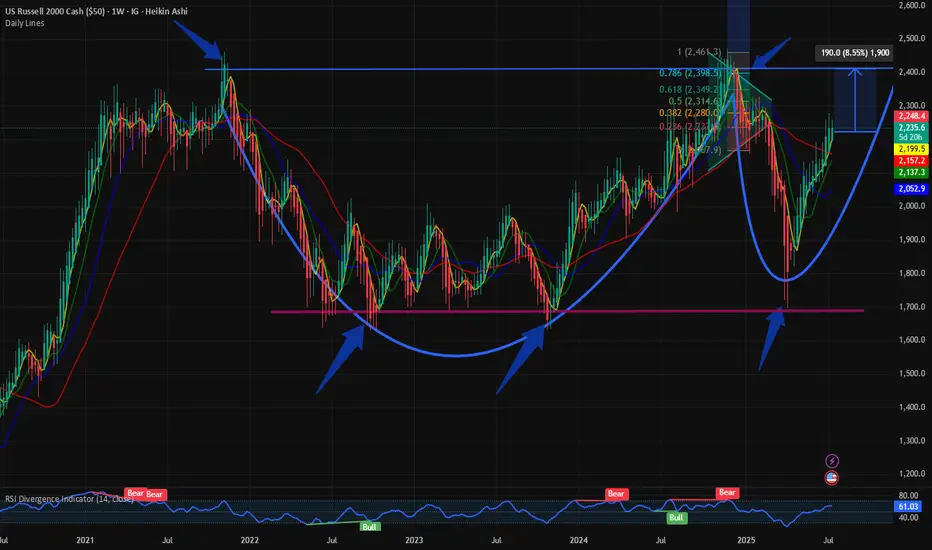
$RUSSEL: Completion of Cup and Handle formation or higher?The small cap index $RUSSEL has had a good past couple of months and has bounced back from its lows. We visited the small cap index on May 1st when we identified the trend reversal. The $RUSSEL was in the recovery mode after the Liberation Day capitulation.
IG:RUSSELL in a bounce back mode. But upside is capped @ 2400 for IG:RUSSELL by RabishankarBiswal — TradingView
This cup and handle pattern is still on hold, and I also predicted that the upside is capped @ 2400. Currently the $RUSSEL is @ 2222.
So how much upside can we expect from here with TVC:DXY making new lows? My assumption is that $RUSSEL will fail to break above 2400, and the handle part will not break out of the reverse neckline. So, the upside in the small caps is capped @ 2400 which seems to be a major resistance indicating a 9% upside from here.
Verdict : $RUSSEL Cup and handle pattern nearing completion. 2400 is the upper resistance. Still some more room to run.
Russell 2000 H4 | Potential bounce off a swing-low support?The Russell 2000 (US2000) is falling towards a swing-low support and could potentially bounce off this level to climb higher.
Buy entry is at 2,210.84 which is a swing-low support that aligns closely with the 38.2% Fibonacci retracement.
Stop loss is at 2,155.00 which is a level that lies underneath an overlap support and the 50% Fibonacci retracement.
Take profit is at 2,276.04 which is a swing-high resistance.
High Risk Investment Warning
Trading Forex/CFDs on margin carries a high level of risk and may not be suitable for all investors. Leverage can work against you.
Stratos Markets Limited (tradu.com ):
CFDs are complex instruments and come with a high risk of losing money rapidly due to leverage. 63% of retail investor accounts lose money when trading CFDs with this provider. You should consider whether you understand how CFDs work and whether you can afford to take the high risk of losing your money.
Stratos Europe Ltd (tradu.com ):
CFDs are complex instruments and come with a high risk of losing money rapidly due to leverage. 63% of retail investor accounts lose money when trading CFDs with this provider. You should consider whether you understand how CFDs work and whether you can afford to take the high risk of losing your money.
Stratos Global LLC (tradu.com ):
Losses can exceed deposits.
Please be advised that the information presented on TradingView is provided to Tradu (‘Company’, ‘we’) by a third-party provider (‘TFA Global Pte Ltd’). Please be reminded that you are solely responsible for the trading decisions on your account. There is a very high degree of risk involved in trading. Any information and/or content is intended entirely for research, educational and informational purposes only and does not constitute investment or consultation advice or investment strategy. The information is not tailored to the investment needs of any specific person and therefore does not involve a consideration of any of the investment objectives, financial situation or needs of any viewer that may receive it. Kindly also note that past performance is not a reliable indicator of future results. Actual results may differ materially from those anticipated in forward-looking or past performance statements. We assume no liability as to the accuracy or completeness of any of the information and/or content provided herein and the Company cannot be held responsible for any omission, mistake nor for any loss or damage including without limitation to any loss of profit which may arise from reliance on any information supplied by TFA Global Pte Ltd.
The speaker(s) is neither an employee, agent nor representative of Tradu and is therefore acting independently. The opinions given are their own, constitute general market commentary, and do not constitute the opinion or advice of Tradu or any form of personal or investment advice. Tradu neither endorses nor guarantees offerings of third-party speakers, nor is Tradu responsible for the content, veracity or opinions of third-party speakers, presenters or participants.
