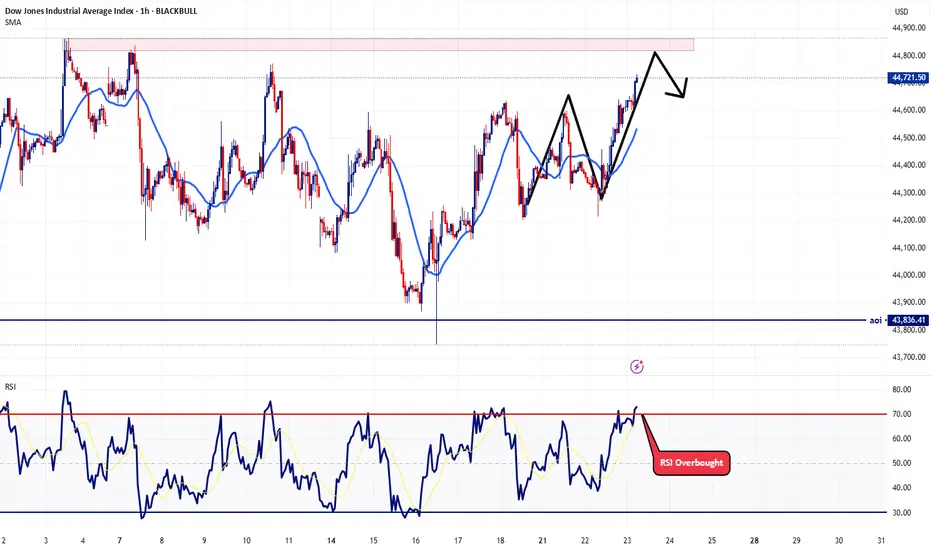
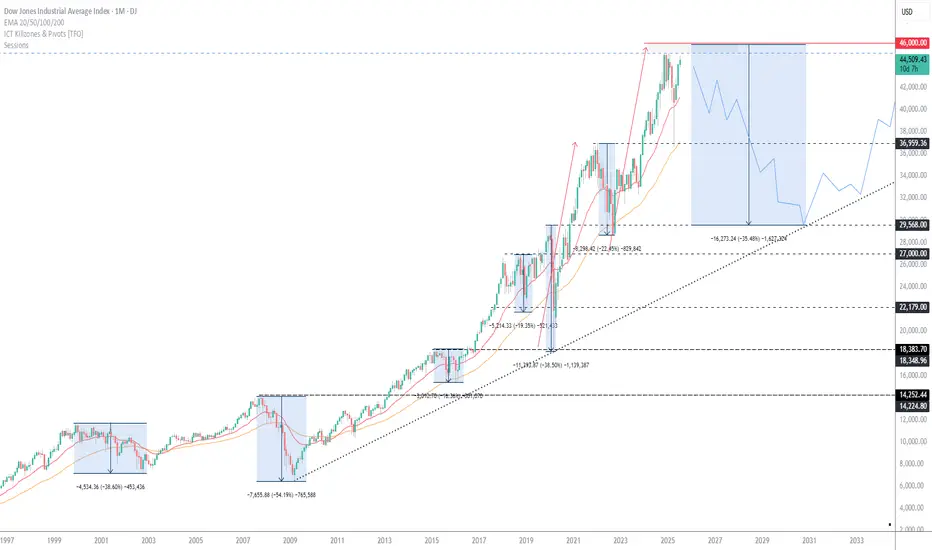
US30 Massive Bullish Breakout!
HI,Traders !
#US30 is trading in a strong
Uptrend and the price just
Made a massive bullish
Breakout of the falling
Resistance line and the
Breakout is confirmed
So after a potential pullback
We will be expecting a
Further bullish continuation !
Comment and subscribe to help us grow !
US30 trade ideas

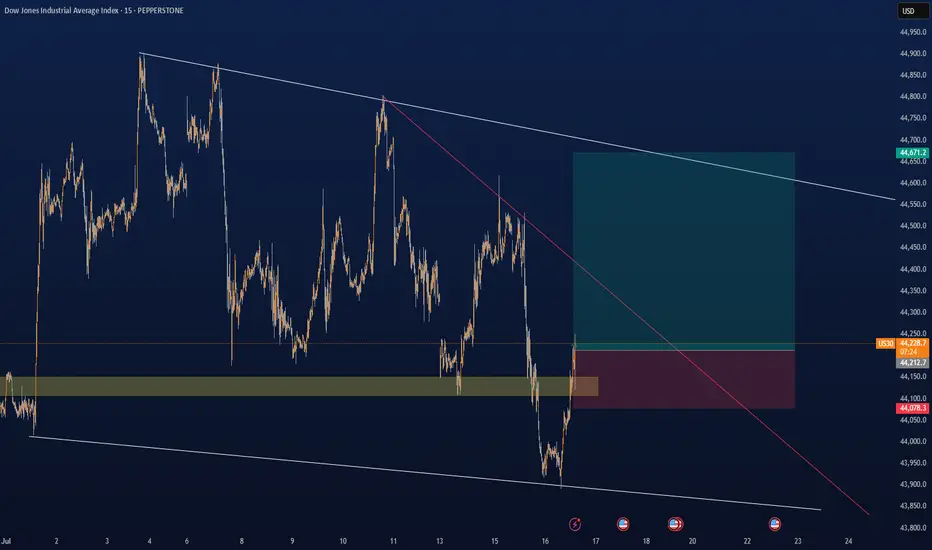
US30: Local Bearish Bias! Short!
My dear friends,
Today we will analyse US30 together☺️
The in-trend continuation seems likely as the current long-term trend appears to be strong, and price is holding below a key level of 44,774.9 So a bearish continuation seems plausible, targeting the next low. We should enter on confirmation, and place a stop-loss beyond the recent swing level.
❤️Sending you lots of Love and Hugs❤️

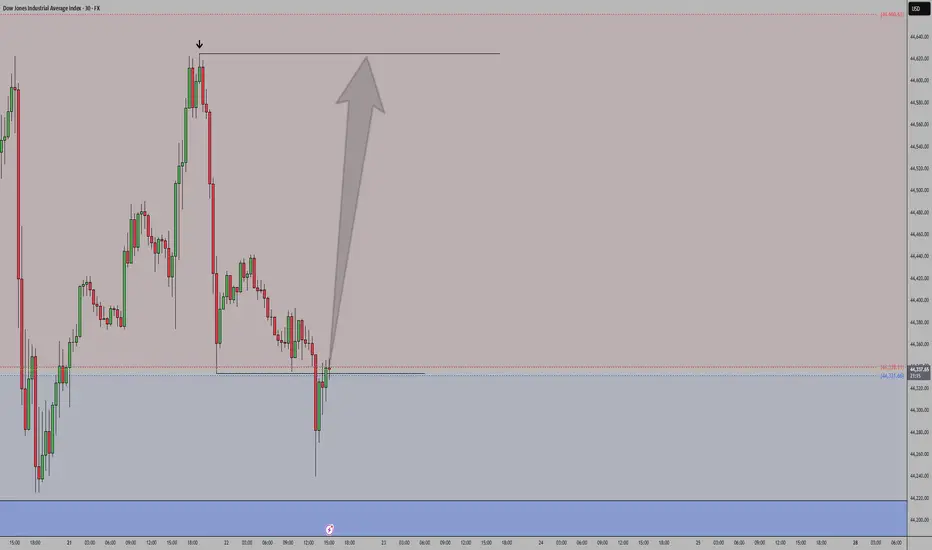
US30 - What I believe will happen todayConsidering today is now Wednesday and Wednesday's have a consistency of being one of those off days. Primarily because usually there are Fed speeches on this day that manipulate the market. With that said, I'm expecting price action to play out how I plotted the arrows on the chart. I believe there is still some further upside for today but then I believe we might get that intraday correction around 11:am - noon EST.
Let's see how today plays out. Trade safe
US30 US30 maintains a bullish outlook, supported by improving economic data, rotation into industrials and value stocks, and resilient corporate earnings. As long as price holds above key support levels, the broader uptrend remains intact.

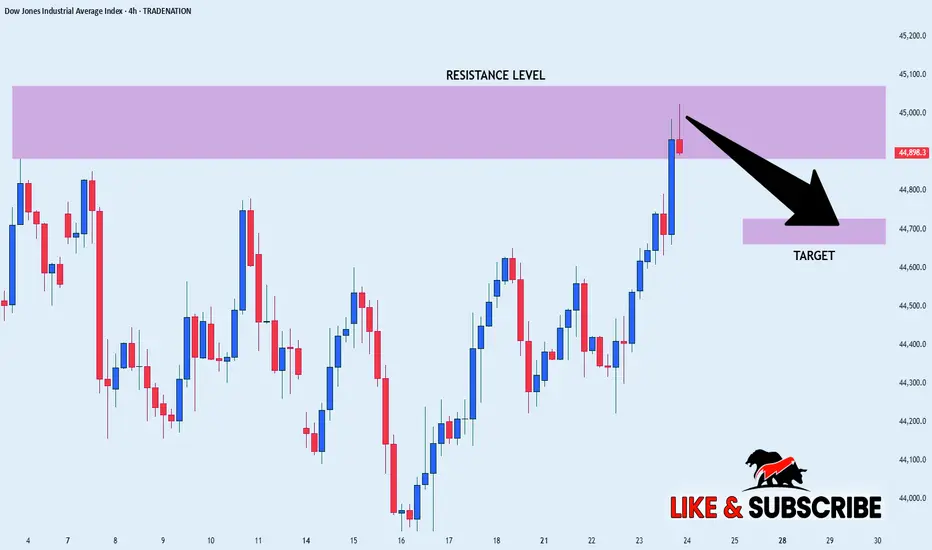
US30 SHORT FORM RESISTANCE|
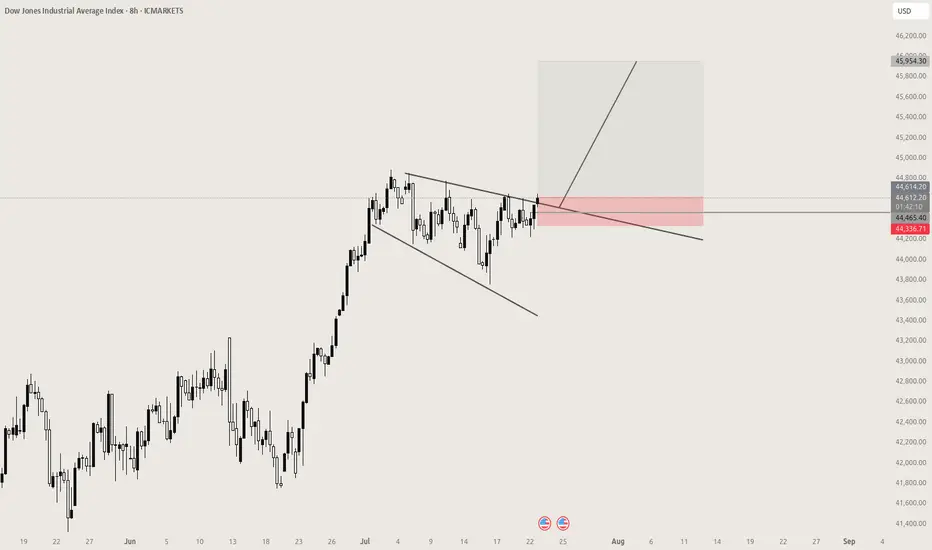
✅DOW JONES index keeps
Growing in a strong uptrend
And we are bullish biased long-term
However the price has hit an all-time-high
Resistance level of 45,072(which can be seen
Further left you zoom out on higher TF)
So as we are already seeing a local
Bearish reaction we will be
Expecting a local bearish correction
SHORT🔥
✅Like and subscribe to never miss a new idea!✅
Disclosure: I am part of Trade Nation's Influencer program and receive a monthly fee for using their TradingView charts in my analysis.
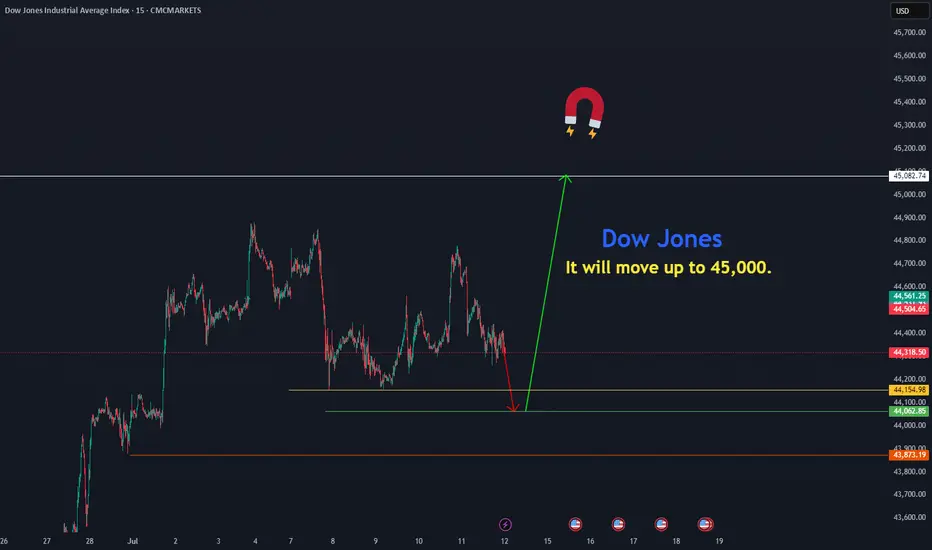
Dow Jones move upThe Dow Jones is resuming its rally toward 45,082 from the price zones of 44,154.97 and 44,000.
CMCMARKETS:US30
US30: The Market Is Looking Down! Short!
My dear friends,
Today we will analyse US30 together☺️
The recent price action suggests a shift in mid-term momentum. A break below the current local range around 44,306.1 will confirm the new direction downwards with the target being the next key level of 44,263.8..and a reconvened placement of a stop-loss beyond the range.
❤️Sending you lots of Love and Hugs❤️

US30 Dow Jones New All Time HIGHMost people over complicate things, mostly the idea is right in front of you yet most don't believe in what they trade; simple bull flag, simple new ATH, that's it. believe it.
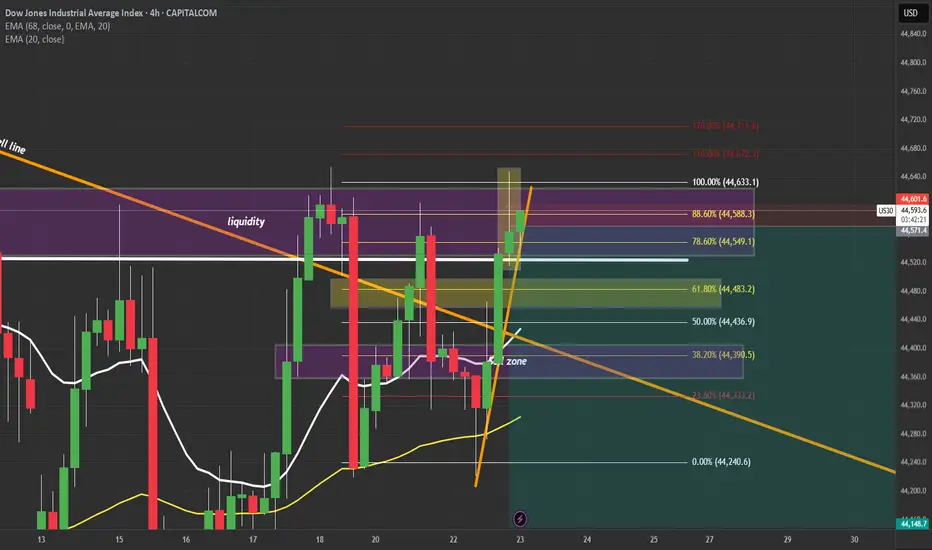
US30 | Inverted Hammer at Key Supply Zone – Reversal or BreakoutUS30 just printed an inverted hammer on the 4H at a major supply zone (44,550–44,600). This is a critical decision point:
✅ Bearish Case:
If price rejects and closes back below 44,530, sellers could take control with targets at 44,380 → 44,180 → 44,020.
✅ Bullish Fakeout:
If price breaks and holds above 44,620, expect a push toward 44,700 and 44,900.
📌 What I’m Watching:
Rejection candle + bearish close → short entries.
Strong breakout candle with retest → long continuation.
Key Levels:
🔴 Resistance: 44,550–44,600
🟢 Support: 44,380 → 44,020
⚠️ Manage risk carefully. Volatility is high and liquidity hunts are common in this zone.
💬 Do you think we reject here or break out higher? Drop your thoughts below!
#US30 #DowJones #PriceAction #SmartMoney #TradingView #TechnicalAnalysis #IndicesTrading
Buy
Rejection Level
Daily Volume
Market Structure Shift
London Session
Trend Line Break
Untapped Order Point
US30 continues to exhibit bullish momentumThe US30 index continues to exhibit bullish momentum, driven by strong earnings reports and robust U.S. economic data. The key support zone around 44,300 has held firm, reinforcing confidence among buyers.
As long as the price remains above 44,300, the uptrend is expected to persist Upside target: 45,000 remains in focus. a focus on the 1H Candle close above 44,000 we could expect price could push more upside.
You may find more details in the chart Trade wisely best of luck buddies
Ps: Support with like and comments for better analysis Thanks for Supporting.

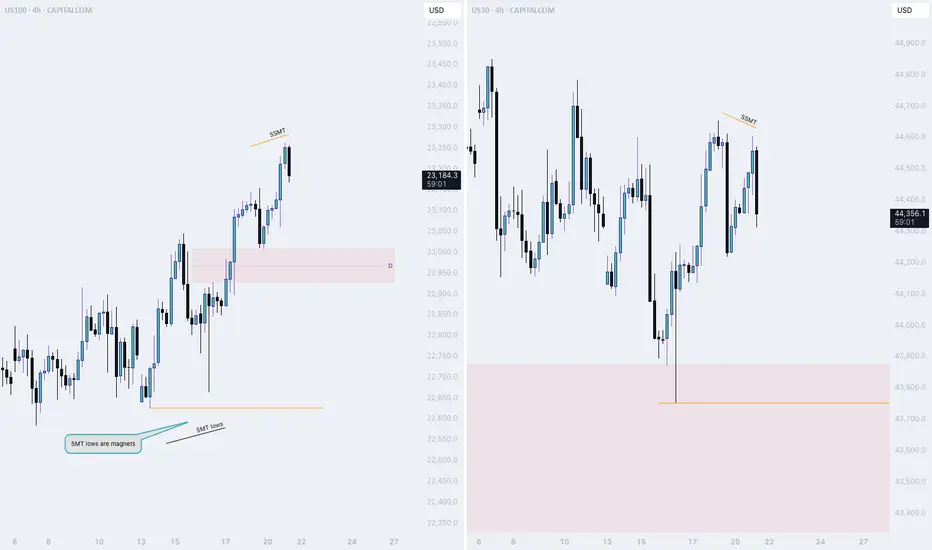
NQ thread: Short ideaMonday started off bullish, but only to drop at the end of the session.
Here is a thread on what is happening and on which narratives I view the market
Starting off with the 4H Time frame, we witnessed NQ and ES taking last weeks high.
YM did not.
This is the first stage of the movement. To find the second stage, we need to dive deeper into the lower timeframes..
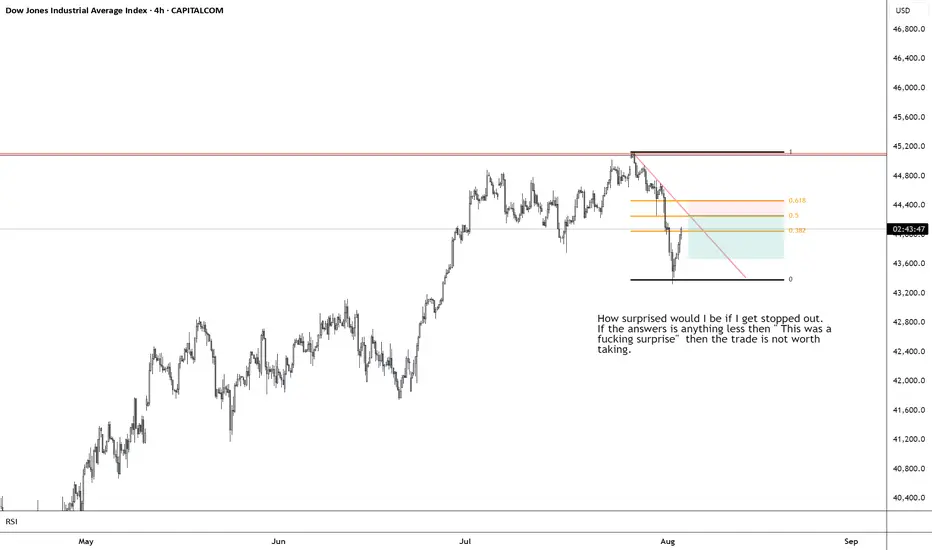
US30 TRADE IDEA 4 AUGUST 2025The US30 (Dow Jones Industrial Average) is showing signs of a near-term bearish bias after breaking down from its rising daily channel and rejecting at the 44,700–45,100 supply zone, which coincides with a key former support level now acting as resistance. From a Smart Money Concepts perspective, this zone represents a recent order block where institutional selling pressure originated, making it a high-probability area to look for short entries if price retests with bearish confirmation, such as a daily bearish engulfing candle, a long rejection wick, or a clear lower-high formation. The first major downside target lies around 43,062, aligning with an intermediate demand zone, with an extended target toward 42,500, where deeper demand and prior consolidation converge. Stops should be placed above 45,150 to invalidate the bearish setup. Conversely, if price drops into the 42,800–43,000 demand zone and shows strong bullish reversal patterns, there is scope for a tactical countertrend long back toward 44,700–45,100, provided that geopolitical and macro conditions turn supportive. Fundamentally, the market remains caught between optimism over potential Federal Reserve rate cuts later this year and uncertainty stemming from the Fed’s cautious, data-dependent stance. Geopolitical risks—particularly heightened tensions in the Middle East and ongoing U.S.–China trade friction—are adding to volatility and could weigh on global risk sentiment, especially if oil prices spike and inflation concerns reemerge. These risks, combined with political uncertainty in the U.S., favor selling into rallies until there is a clear shift in macro direction. Key events to monitor include upcoming Fed communications, developments in Middle East conflicts, and any major U.S.–China trade headlines, all of which could either reinforce the short bias or trigger a sentiment-driven reversal. For now, the preferred approach is to sell into strength near the supply zone with defined risk, manage positions closely around the 43,000 demand area, and remain flexible to flip bias if price action and fundamentals align for a reversal.

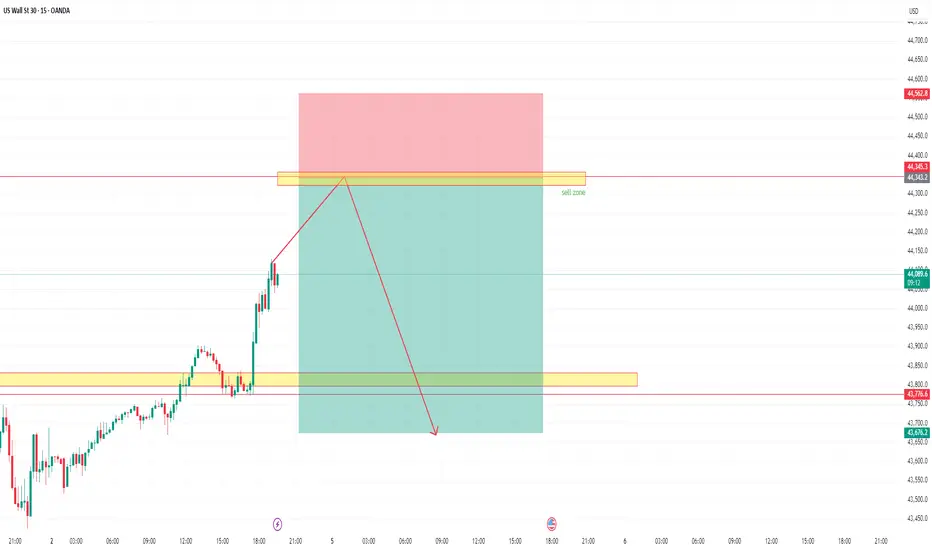
US 30 -Short -TGT 43682US30 to fall to the levels of 43682. The Index expected to hit the levels of 44343 before the fall.
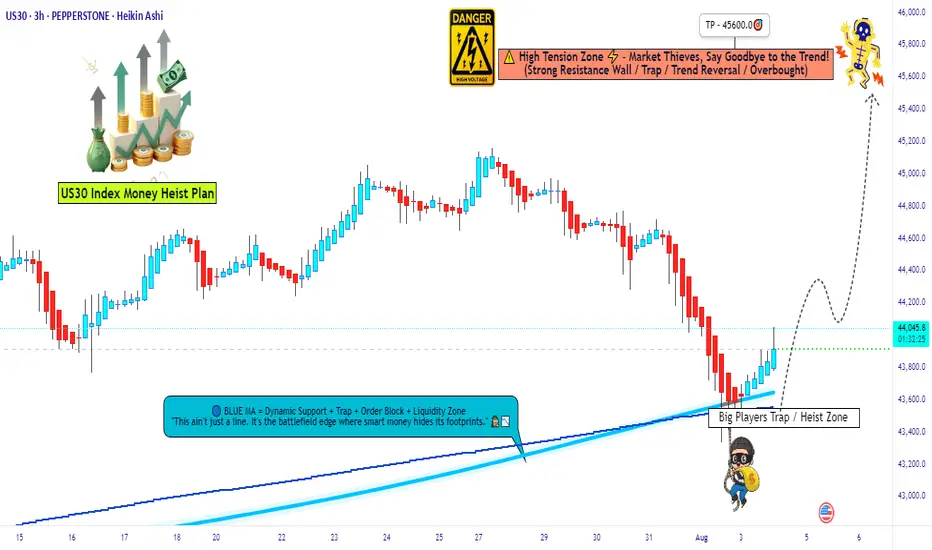
Heist Alert: Dow 30 Bullish Surge Incoming – Lock In Targets🦹♂️💎 “US30 Gold Vault Heist” – Thief’s Bullish Break-In Plan! 🚨📈
(Brought to you by Thief Trader – Layered Entry. Zero Mercy. Big Bags.)
🌍 Welcome to the Heist Floor, Global Market Bandits!
🎯 US30 is the next vault on the hitlist – and we’re going in loud but calculated.
💣 The Setup: Bullish Raid in Progress!
The Thief has eyes on Wall Street's armored vault — US30 Index — gearing up for a multi-layered bullish assault.
💼 Using limit orders like C4 on the door hinges, we’re stacking precise entries for maximum loot extraction. This isn’t gambling — this is organized market crime.
🔓 Entry Protocol – Any Price Level Is Breachable
🪜 Layered Limit Orders: Entry at any market level, multiple orders spread like a thief’s toolkit.
No sniper candle required — we work the shadows and stack with precision.
(Use the 15m-1H TF to tighten your strike zone.)
🛑 Stop Loss – The Getaway Hatch
📍 SL parked at 43300.0 – if the mission fails, we vanish clean.
No chasing losses — the next heist awaits.
📈 Take Profit – The Loot Vault
🎯 Target: 45600
That’s the gold room, the top floor, the getaway car location.
Use trailing SLs to secure the bag mid-run if resistance agents start showing up.
🧠 Behind the Heist – What’s Fueling This Move?
Global risk-on tone? ✅
Dow futures resilience? ✅
Thief’s sentiment meter flashing GREEN? ✅
Index rebalancing & sector flow favoring bulls? ✅
We don’t just trade the chart. We rob the macro narrative.
🚫 News Caution – No Sudden Sirens
Avoid entering during red folder data drops or FOMC speeches.
Stay ghosted. Let the volatility settle, then strike. 🕵️♂️
💥 Smash the BOOST Button 💖 If You’re With the Crew!
Let’s run this like a proper cartel of information — share it, save it, tag your trader circle.
Every like supports the next robbery plan.
No signals. No fluff. Just pure market exploitation.
📌 Disclaimer: Educational analysis only. No financial advice. Manage your risk like a true thief — never expose the whole bag.
💼📊 Thief Trader Out — More heist maps coming soon.
🔐 Rob Smart. Stack Heavy. Run Fast. 🦹♂️💸📈
Dow Jones Index (US30) Technical Analysis:The Dow Jones Index has bounced from the 43,350 support after a sharp decline, currently trading near 44,000, testing nearby resistance.
🔹 Bearish Scenario:
If the price fails to break above 44,200 and selling pressure resumes, a drop below 43,800 could push the index back toward the 43,350 support area.
🔹 Bullish Scenario:
If the index breaks and holds above 44,200, the bullish move may continue toward 44,700, with further potential toward the 45,150 resistance zone.
⚠️ Disclaimer:
This analysis is not financial advice. It is recommended to monitor the markets and carefully analyze the data before making any investment decisions.
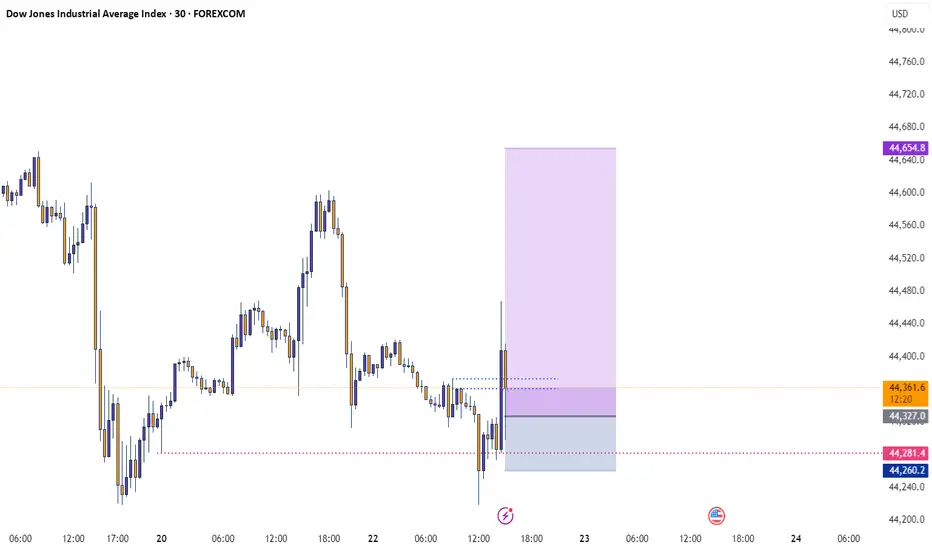
Sell US30US30 Sell Idea
Bearish Flag Pattern at NY open. Price should rapidly decline in the next few hours

US30 ShortUS30 Short Setup – Bearish Retest Play
Idea: Looking for a short opportunity after a clean break of structure and trendline.
Breakdown:
Trendline Break: The rising trendline (yellow) has been decisively broken, signaling a shift in market structure.
Structure Shift: We saw a strong impulsive move to the downside, breaking previous higher lows and confirming bearish intent.
Key Resistance Zones: Price is now pulling back toward a key supply zone between 44,100 – 44,300, which aligns with previous support-turned-resistance.
Plan: I’m anticipating a potential lower high formation around this zone, followed by rejection and continuation to the downside.
Target Zone: My short target is the demand area around 42,900 – 42,600 where price last consolidated before the previous rally.
Invalidation: If price reclaims and holds above 44,400, the short idea becomes invalid.
