the trap has layerswhat if i told you the dxy was not done yet,
what if i told you, there was 1 more push up,
1 more test before it truly breaks and starts a bull market.
what if i told you that on that final test, that final push up,
the crypto market breaks and takes everything.
---
you probably wouldn't believe me.
---
looking at the dxy as a simple zig-zag with a complex flat in the b-wave.
once wave b is completed, at about 110-111,
i predict it drops down, deep
and while it drops,
it triggers alt season.
🌙
USDX trade ideas

DXY OUTLOOK BEFORE FOMC | Will the Dollar Break Trend DXY OUTLOOK BEFORE FOMC | Will the Dollar Break Trend or Just Retrace?
The US Dollar Index (DXY) has rebounded after weeks of relentless selling pressure, but this bounce is now approaching key decision zones just ahead of two critical events: the April PCE report and the next FOMC meeting. With macro data and sentiment diverging, traders should closely monitor how the dollar reacts to upcoming catalysts.
🌍 MACRO & FUNDAMENTAL CONTEXT
Core PCE Price Index (Apr) – due Friday – is the Fed’s preferred inflation gauge. A higher-than-expected print may reinforce the “higher for longer” stance on rates.
FOMC Minutes revealed a growing divide within the committee: some members remain open to further tightening if inflation stalls.
Bond market stress is emerging again, as 10Y yields hover near 4.5%. Fiscal concerns and treasury auctions are weighing on investor sentiment.
Political noise – particularly from former President Trump’s shifting tariff threats – adds short-term volatility to USD expectations.
🧠 Bottom line: While the dollar has regained ground, macro risks remain asymmetric. A hot PCE may spark short-term demand for USD, but structural credibility risks are still on the table.
📊 TECHNICAL INSIGHT – H1 STRUCTURE
Price Channel: DXY broke slightly above a well-respected descending channel that started mid-May.
EMA Confluence: EMA 13, 34, and 89 are beginning to align upward but haven’t fully confirmed a bullish trend yet.
Key Retest Zone: 99.08 is a critical zone — a Fibonacci 38.2% level of the recent breakout. A hold here may support another test higher.
🔑 KEY TECHNICAL LEVELS
Immediate Support: 99.08 (Fib 38.2% + channel retest)
Mid Resistance: 100.02 (round number + previous structure high + near 200 EMA)
Major Target Zone: 100.48 (Fib 61.8% + multi-day pivot)
📈 POTENTIAL PRICE SCENARIOS
If DXY respects 99.08, a continuation toward 100.02 and even 100.48 is plausible as a technical correction.
If DXY fails to hold 99.08, the breakout above the trend channel may turn into a false break, opening the door for a re-test of lower channel support near 98.30.
Watch for price behavior around 100.02 — aggressive sellers may re-enter at this level, especially if macro data disappoints.
⚠️ STRATEGIC REMINDER
Avoid chasing mid-range price action.
Let the market reveal its hand post-PCE.
Volatility is expected to spike — be patient and let key levels define directional conviction.

DXY Bearish27 Mei 2025
DXY continuation bearish,
currently retrace and there is reversal signal.
SELL USDXXX atau BUY XXXUSD & GOLD
BIAS To Bearish

DXY 4hr char anlaysis I expect the DXY to enter a temporary bullish phase, likely as part of a corrective move. The price may rise toward the 100.781 – 101.00 zone.
From that level, I anticipate a bearish reversal, with the potential for the price to decline toward the 97.00 – 94.00 region.
This outlook is based on my own understanding and experience in the market — it's not guaranteed to be 100% accurate, but it's a well-considered forecast. I estimate there's about an 80% probability that the market will follow this scenario.

DOLLAR I Weekly CLSI Model 2- Big expansion comingHey, Market Warriors, here is another outlook on this instrument
If you’ve been following me, you already know every setup you see is built around a CLS range, a Key Level, Liquidity and a specific execution model.
If you haven't followed me yet, start now.
My trading system is completely mechanical — designed to remove emotions, opinions, and impulsive decisions. No messy diagonal lines. No random drawings. Just clarity, structure, and execution.
🧩 What is CLS?
CLS is real smart money — the combined power of major investment banks and central banks moving over 6.5 trillion dollars a day. Understanding their operations is key to markets.
✅ Understanding the behaviour of CLS allows you to position yourself with the giants during the market manipulations — leading to buying lows and selling highs - cleaner entries, clearer exits, and consistent profits.
🛡️ Models 1 and 2:
From my posts, you can learn two core execution models.
They are the backbone of how I trade and how my students are trained.
📍 Model 1
is right after the manipulation of the CLS candle when CIOD occurs, and we are targeting 50% of the CLS range. H4 CLS ranges supported by HTF go straight to the opposing range.
📍 Model 2
occurs in the specific market sequence when CLS smart money needs to re-accumulate more positions, and we are looking to find a key level around 61.8 fib retracement and target the opposing side of the range.
👍 Hit like if you find this analysis helpful, and don't hesitate to comment with your opinions, charts or any questions.
⚔️ Listen Carefully:
Analysis is not trading. Right now, this platform is full of gurus" trying to sell you dreams based on analysis with arrows while they don't even have the skill to trade themselves.
If you’re ever thinking about buying a Trading Course or Signals from anyone. Always demand a verified track record. It takes less than five minutes to connect 3rd third-party verification tool and link to the widget to his signature.
"Adapt what is useful, reject what is useless, and add what is specifically your own."
— David Perk aka Dave FX Hunter ⚔️

DOLLARThe US Dollar Index (DXY) Yearly Support and Potential Sell-Off to 96 Zone: Role of 10-Year Bond Yields and Interest Rates
1. Technical Outlook: DXY Support Breakdown and 96$ Target and Critical Support Levels.
The DXY recently breached the 200-week moving average (200-WMA), a key multi-year support level, signaling a potential trend reversal .
A sustained break below 98.00 could trigger a steeper decline toward 96.00-95$ long-term uptrend ascending trendline acting as 6months support floor connecting 2008, 2011 and 2020, . However, analyst projections also highlight the 96–95 zone as a plausible target if Fed rate cuts and macroeconomic headwinds persist .
Current Context (May 2025):
The DXY is testing 98.4 on weekly charts, with bears eyeing lower supports amid weakening USD sentiment .
A drop to ascending trend line on 6months would align with forecasts tied to Fed policy shifts and global currency strength .
2. 10-Year Bond Yield and Interest Rate Dynamics
Direct Relationship with the Dollar:
The 10-year Treasury yield and USD share a strong correlation: higher yields attract foreign capital, boosting dollar demand, while lower yields weaken the currency .
As of May 2025, the 10-year yield hovers near 4.54%, down from peaks but still elevated compared to global peers .
Impact of Rate Cuts and Policy Divergence:
Fed Rate Expectations: Markets price in five Fed rate cuts by late 2025, which would reduce yield advantages and pressure the dollar .
Policy Divergence: The ECB and BoJ are expected to maintain or ease policies, while the Fed delays cuts, temporarily supporting USD. However, prolonged easing could reverse this advantage .
3. Key Drivers of Dollar Weakness Toward 96-95 ascending trendline
Bearish Factors:
Yield Decline: A drop in the 10-year yield (e.g., due to Fed cuts or recession fears) would erode USD appeal. For every 1% decline in yields, the DXY could fall 3–5% .
Risk Sentiment: A "soft landing" scenario or rally in risk assets (stocks, commodities) may reduce safe-haven USD demand .
Tariff and Geopolitical Risks: Escalating US-China/EU trade tensions could weaken the USD if global growth fears dominate .
Bullish Counterpoints:
Hawkish Fed Surprises: Strong US data (e.g., inflation, jobs) may delay rate cuts, keeping yields and the dollar elevated .
Safe-Haven Flows: Renewed geopolitical/market turmoil could revive USD demand despite lower yields .
4. Summary: Interplay Between Yields, Rates, and DXY
Factor Impact on DXY
10-Year Yield Rises Strengthens USD (investor inflows)
10-Year Yield Falls Weakens USD (capital outflows)
Fed Rate Cuts Pressures USD (narrows yield gap)
ECB/BoJ Easing Supports USD (policy divergence)
Path to 96: A combination of Fed rate cuts, declining 10-year yields, and stronger global currencies (EUR, JPY) could drive the DXY toward 96–95 .
Reversal Risks: Hawkish Fed pivots or safe-haven demand amid crises may stall the decline.
Conclusion
The DXY’s potential drop to the 96–95 zone hinges on sustained declines in the 10-year Treasury yield and Fed rate cuts, compounded by technical breakdowns. While policy divergence and safe-haven flows offer temporary USD support, broader macroeconomic shifts (e.g., tariff risks, global growth) could accelerate the sell-off. Traders should monitor yields, Fed rhetoric, and technical levels on demand floor and supply roof for confirmation of bearish or bullish momentum

US Dollar Index - Classic Bearish PatternUS Dollar index has successfully broken down from the previous support which held strongly in the past, after support broke we saw successful retest of the support as the new resistance and got rejected from the resistance, now its heading towards the next support
Follow Our TradingView Account for More Technical Analysis Updates, | Like, Share and Comment Your thoughts.
Cheers
GreenCrypto

Change the trend It is expected that a trend change will take place within the current support range and we will witness the start of an uptrend. Otherwise, the downtrend will continue along the specified path.

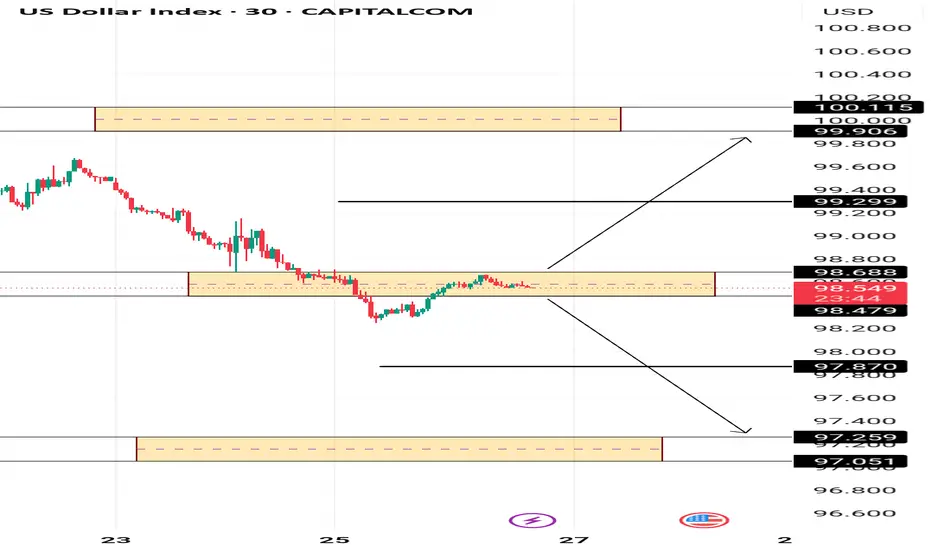
USD INDEX PIVOT AREAThe USD INDEX is currently prefering the bears as long as the pivot area holds .However abreak above could bring some strength to the index with 99.29 and 99.90 as targets.
DXY: Move Down Expected! Short!
My dear friends,
Today we will analyse DXY together☺️
The recent price action suggests a shift in mid-term momentum. A break below the current local range around 98.579 will confirm the new direction downwards with the target being the next key level of 98.459 and a reconvened placement of a stop-loss beyond the range.
❤️Sending you lots of Love and Hugs❤️

DXY Continuation Bearish Bias. 26 Mei 2025
DXY continuation bearish,
Market slow due to bank holiday.
currently retrace and will wait for another signal tomorrow.
SELL USDXXX atau BUY XXXUSD & GOLD
BIAS to no trade today.

USXUSD OHLC Weekly ProfileUSXUSD OHLC Weekly Profile
Expecting a bearish week.
Notice how Bank Holiday aligns for a sponsorship lower from the Daily FVG.
Mix that with Economic Calendar - Thursday & Friday delivery lower, expecting a mid-week reversal.

DXY on daily tfSo we have this on daily tf. and there is a sign of rejection. hopefully this will validate my bias as long position for dxy

Dxy weekly charton this time frame, it shown clearly that price rejected at key level, in which if price dont take out the recent low at the end of the trading week, definitely dxy will continue bull run...

Dxymonthly view.
i will like to see dxy seek more lower price before going long again. but lets see if dxy will close the month with same bearish preasure or end up closing as indicition or rejection

DXY Possible Retest of Bearish FlagEven though the overall trend is still bearish, a pullback might be needed since we have a confirmed breakout of a bearish flag on the daily TF.

DXY | Harmonic Patterns | Technical Analysis. Recovery Underway?TVC:DXY
Over recent sessions, I’ve been highlighting a critical zone for the TVC:DXY between $98.70 and $98.80 , where several important technical patterns are forming that could signal the start of a rebound after the recent decline.
➡️ The dollar broke below the Head and Shoulders neckline at $100.27 , hitting the default target I projected at $98.69 , which corresponds to the 200% Fibonacci extension. This is a classic confirmation of the breakdown and subsequent drop.
➡️ However, since reaching this level, the TVC:DXY has begun to form strong bullish patterns:
Bullish Crab Pattern at the 161.8% Fibonacci extension, projected at $98.91
Bullish Alt-Bat Pattern at the 113% Fibonacci extension, at $98.80
These emerging bullish setups suggest a solid potential reversal, indicating that the TVC:DXY might be preparing to recover.
🎯 The default targets for these bullish patterns are around $99.95 , aligning with key resistance zones and Fibonacci confluence.
Summary: The TVC:DXY has completed the expected downward move from the Head and Shoulders pattern and is now showing clear technical signs of a possible reversal. The price action in the coming sessions will be critical to confirm whether the index can sustain this recovery toward higher levels.
Safe Traders,
André Cardoso
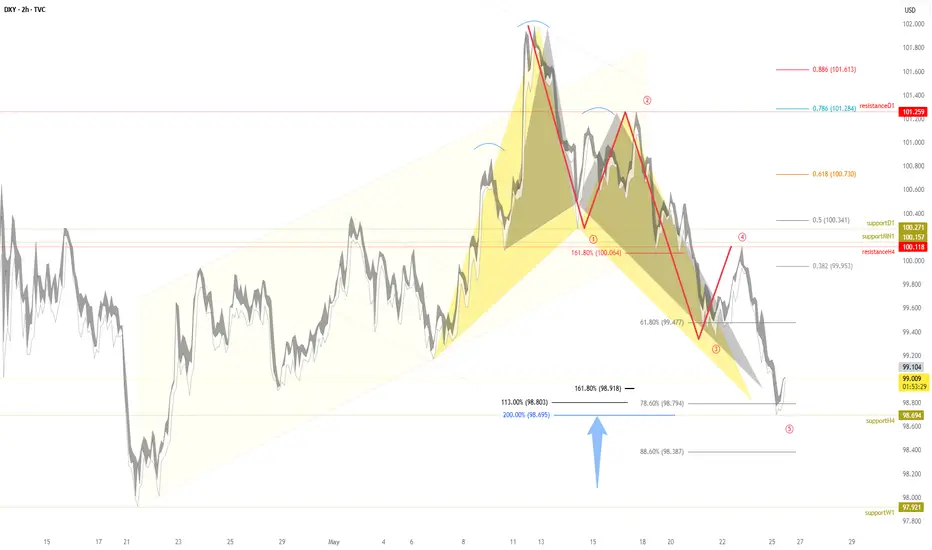
DXY 4hr chart analysis I expect the DXY to enter a temporary bullish phase, likely as part of a corrective move. The price may rise toward the 100.82 – 101.25 zone.
From that level, I anticipate a bearish reversal, with the potential for the price to decline toward the 97.00 – 94.00 region.

My Thoughts #011What I see coming is sells
Here's why
Because the pair just gave a LH in the current bearish trend of the HTF
and the pair just choch and it's only sells after a retest
It could just continue selling
But I will wait to see the market's hand before taking my first trades
This pair could buy so use proper risk management
Let's do the most

Bullish bounce off overlap resistance?The US Dollar Index (DXY) is falling towards the pivot and could bounce to the 1st resistance.
Pivot: 97.78
1st Support: 95.22
1st Resistance: 101.81
Risk Warning:
Trading Forex and CFDs carries a high level of risk to your capital and you should only trade with money you can afford to lose. Trading Forex and CFDs may not be suitable for all investors, so please ensure that you fully understand the risks involved and seek independent advice if necessary.
Disclaimer:
The above opinions given constitute general market commentary, and do not constitute the opinion or advice of IC Markets or any form of personal or investment advice.
Any opinions, news, research, analyses, prices, other information, or links to third-party sites contained on this website are provided on an "as-is" basis, are intended only to be informative, is not an advice nor a recommendation, nor research, or a record of our trading prices, or an offer of, or solicitation for a transaction in any financial instrument and thus should not be treated as such. The information provided does not involve any specific investment objectives, financial situation and needs of any specific person who may receive it. Please be aware, that past performance is not a reliable indicator of future performance and/or results. Past Performance or Forward-looking scenarios based upon the reasonable beliefs of the third-party provider are not a guarantee of future performance. Actual results may differ materially from those anticipated in forward-looking or past performance statements. IC Markets makes no representation or warranty and assumes no liability as to the accuracy or completeness of the information provided, nor any loss arising from any investment based on a recommendation, forecast or any information supplied by any third-party.

BEARS STILL IN CHARGE ! DXY- USD INDEX FORECAST Q2 W22 Y25DXY USD INDEX FORECAST Q2 W22 Y25
BEARS CRUSHING THE USD!
Professional Risk Managers 👋
Welcome back to another FRGNT chart update📈
Diving into some Forex setups using predominantly higher time frame order blocks alongside confirmation breaks of structure.
✅ U.S. dollar index is a measure of the value of the dollar against a basket of six foreign currencies.
✅The currencies are the Euro, Swiss franc, Japanese yen, Canadian dollar, British pound, and Swedish krona.
🔑 Remember, to participate in trading comes always with a degree of risk, therefore as professional risk managers it remains vital that we stick to our risk management plan as well as our trading strategies.
Pairs to look out for -
EURUSD - BUY
USDCHF - SELL
USDJPY - SELL
USDCAD - SELL
GBPUSD - BUY
- Perhaps it's time to accept that a recovery in the DXY is not occurring anytime soon...
📈The rest, we leave to the balance of probabilities.
💡Fail to plan. Plan to fail.
🏆It has always been that simple.
❤️Good luck with your trading journey, I shall see you at the very top.
🎯Trade consistent, FRGNT X

DXY 1W (Dollar Index Weekly Chart)All eyes on the Dollar’s weekly support zone — it’s looking vulnerable and may attempt a breakdown next week. 📉
If that breakdown confirms, the Dollar could head toward Support 1, and possibly Support 2 in the coming weeks.
And you know what that means...
Bullish for crypto. 🟢🔥
Stay alert — the coming weeks could get exciting!

DXY Weekly ForecastDXY Weekly Forecast
- keep an eye on 100.2 level for potential total down move
- in any case DXY has to come down to 96.000 level
"I Found the Code. I Trust the Algo. Believe Me, That’s It."
