WHAT WILL HAPPEN NEXT IN THE U.S. ECONOMY WHAT WILL HAPPEN NEXT IN THE U.S. ECONOMY
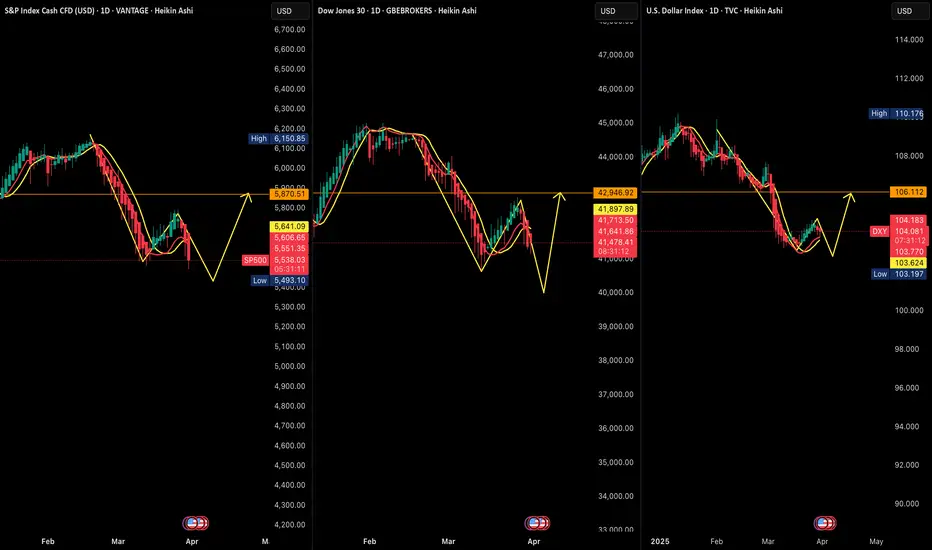
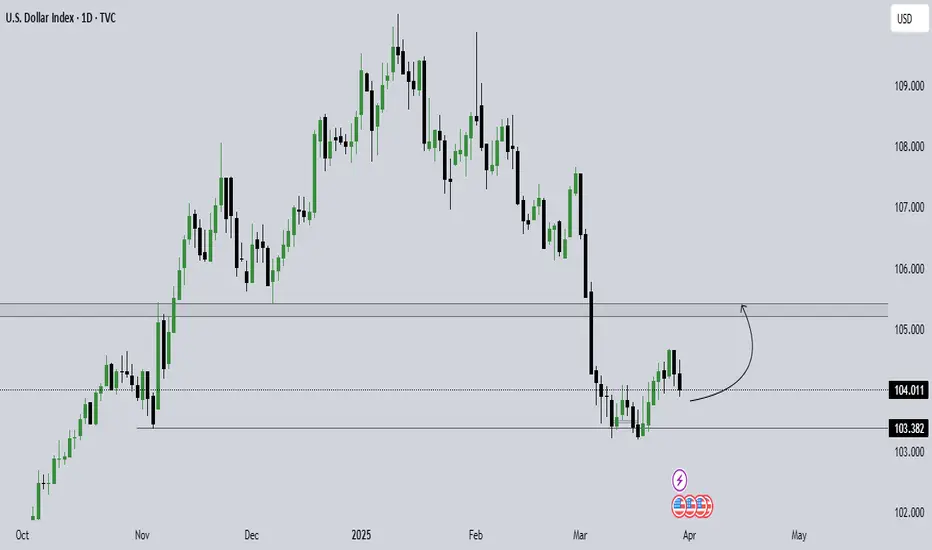
It’s the Dollar Index (DXY) forming a bottom on the D1 timeframe and adjusting upward to the 106 zone. Naturally, U.S. stock markets will experience positive growth again.
This is a signal for the rise of BTC and, conversely, a decline in gold prices. Gold will soon peak in this month of April, making way for the growth of DXY, BTC, U.S. stocks, and technology shares.
This is the art of capital flow within the economy, the financial environment, and the continuous rotation driven by market makers.
Good luck.
USDX trade ideas
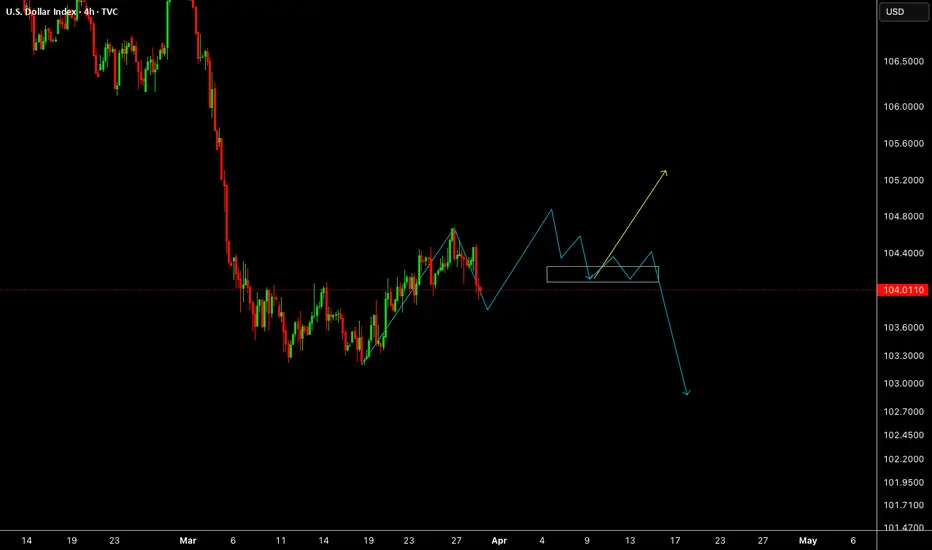
dollarindex 4h forecastLooking for a further decline on the DXY, we have an impulse formation down. Projecting a wave 5 to complete below the previous low.

DXYUS Dollar Index
- Bearish Channel
- Break of Structure
- Completed " 1234 " Impulsive Waves
- Order Block
- Change of Characteristics

DXY on the EdgeTrump's trade policies in Q1 have significantly influenced global markets, with critics arguing that his import tariffs are destabilizing the economic and monetary order. These measures have sparked concerns about U.S. dollar confidence, potentially leading to financial instability and broader economic consequences.
🔹 DXY Technical Analysis
The US Dollar Index (DXY) is at a critical juncture, currently hovering around 103.376—a key level that will determine the next major move.
📈 Bullish Scenario:
If DXY holds above 103.376, it may push towards the 106.160 and 107.595 resistance levels.
📉 Bearish Scenario:
A break below 103.376 could send DXY further down, targeting 101.805 and 100.235 as potential support zones.
📌 Key Levels:
Resistance: 106.160, 107.595
Support: 103.376, 101.805, 100.235
⚠ Risk Disclaimer:
This analysis is for informational purposes only and should not be considered financial advice or a trading signal. Always confirm with your own strategy before making any trading decisions.

Sunday Viper Upcoming week overview. On Sunday's i break down the DXY and the rest of the market giving a forward look and expectation of what we can expect or look for upcoming. I breakdown US30, Nas100, Gold, Oil, BTC and some forex pairs. Possibly a big week ahead with Tariffs coming out April 2nd and NFP on Friday. Looking forward to an exciting volatile week.


Dollar IndexWe are expecting Dollar index to give us reaction above he recent top, if it corrects above the Top then NFP will push it further up otherwise break it down to break the last bottom.
Disclosure: We are part of Trade Nation's Influencer program and receive a monthly fee for using their TradingView charts in our analysis.
DXY's bearish shift confirmed First bearish targets outlined on the chart.
- reacting from a Weekly and Daily fvg
- Lower timeframe orderflow has shifted bearish
- I expect lower price from the 4h fvg, first to the equal lows, but ofc we have targets way lower.
OK be safe byyyy

Watch the DXY fall to 103.205The Dollar Index will drop drastically to 103.205 Price level.. Don't hesitate to capitalize from this Bearish Move... Take advantage of this price action ... Weekly Outlook

My idea for the DXY OANDA:EURUSD OANDA:GBPUSD
Looking at the chart we're seeing buyers exhausting their strength to push price higher, seeing sellers stepping in to take control of the market, if we get a break of the previous low then we'll be expecting price to ride us down to the next demand for possible buy opportunity.
And this move we be good for EU and GU respectively, however I welcome thoughts on this as believe a pipful week is possible. Shalom.

DXY March 30 Weekly AnalysisDXY March 30 Weekly Analysis
*My parent bias is still bear coming into this week.
*No news Monday
*Previous session price is in a discount and in a consolidation cycle.
*Note that price is weaving in between 2 HFT inefficiencies.
*Study Sundays delivery
Since March 18 Price has had a run on buy stops. Price pivoted on Wednesday at the 50 level of the range its trading in.
I like how Price came up to the 50 level of the range its trading in and didn't spend much time there before breaking down. Avoiding the market on high resistance days like Thursday is getting easier to identify. When price is high resistance it is tipping its hand to a larger move coming so be patience and wait for price to come to my levels.
NFC is this week. Will complete my weekly idea once Sundays delivers. My bias is lower prices and suspect it could be a violative week of Price delivery.
Stay humble to what Price prints and don't get stuck in any idea yet be nimble.

DXY Analysis - 31 March - 4 April 2025Key Observations:
Break of Structure (BoS): Multiple bullish BoS on H4 and H1 suggest a potential bullish reversal in the coming week.
Demand Zone (DZ): The H1 demand zone is still holding, indicating a possible liquidity sweep before resuming bullish momentum.
Supply Zone (SZ): Two H1 supply zones above current price act as resistance levels.
Critical Level at 103.84: If price breaks below 103.84, a bearish reversal may align with the higher time frame (HTF) bearish outlook.
Support & Resistance: Several significant support and resistance levels are marked.
RSI Indicator: The RSI is around 31.24, indicating the market is approaching oversold conditions.
Outlook:
Bullish Scenario: If the demand zone holds, the price could reverse upwards, targeting the supply zones.
Bearish Scenario: A break below 103.84 may trigger a deeper drop, aligning with the broader bearish trend.

DXY Daily T.F Forecast This is my forecast for DXY.The market is in Wave 3 of A and Waiting for pullback to wave 4 for a ride down to complete Wave A.Then will have a bigger correction to form Wave B followed by the final Wave C.
NOTE:This are my ideas and not trading advice.

DXY:It is about to witness a quarterly declineBecause concerns about tariffs causing a slowdown in U.S. economic growth have pushed down U.S. Treasury bond yields, the stock market, and the U.S. dollar exchange rate. The U.S. dollar is likely to experience a quarterly decline next week, and we can seize the opportunity to short on rebounds.
Trading strategy:
buy@104.500
TP:103.500
Get daily trading signals that ensure continuous profits! With an astonishing 90% accuracy rate, I'm the record - holder of an 800% monthly return. Click the link below the article to obtain accurate signals now!
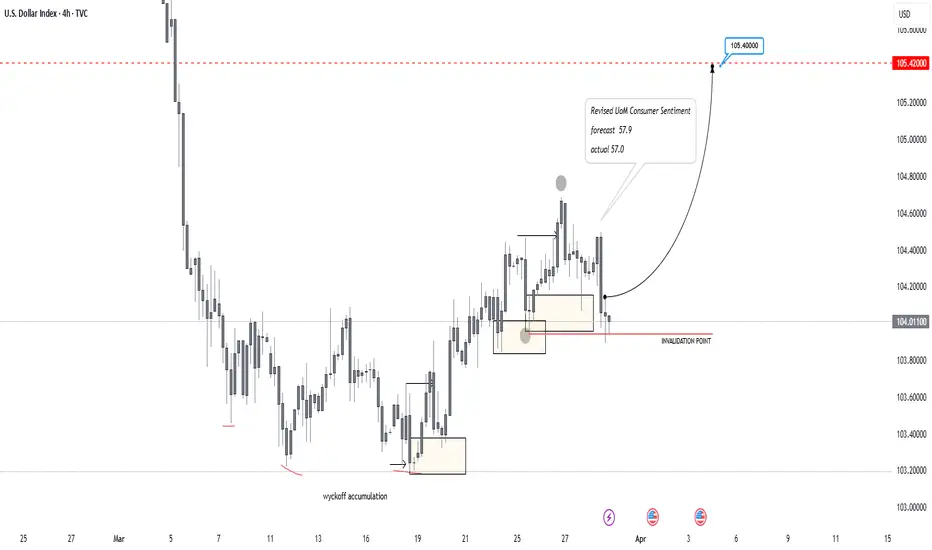
US DOLLAR UPDATE4H demand zone was reached, and price initially reacted strongly with a bullish close. However, buyers lacked momentum, and with fundamentals like Friday’s UoM data coming in lower than forecast, confidence in the economy weakened, leading to a drop.
From a technical standpoint, price will seek lower demand, but for shorts to be confirmed, the invalidation point must be broken, not just spiked. Let’s wait and see how the market unfolds.
Blessings,
T
$DXY IdeaWhen analyzing the weekly DXY chart, we identify the presence of two CRTs: one bullish and one bearish. However, the bearish CRT has a low probability of success due to the candle formation and the fact that the price is still in a discounted region within the range.
Given this, our initial expectation is for the price to drop at the beginning of the week to seek liquidity in the equilibrium region of the daily range, which coincides with the 50% level of the bearish CRT. This movement may act as a correction within the predominant trend, pushing the price up toward the premium region of the weekly range. From that point, we will once again look for selling opportunities, as the market may resume its downward movement.
Based on this analysis, we initially seek selling opportunities down to the equilibrium region. Once this level is reached, we will wait for confirmation of a bullish reversal to look for buying opportunities up to the 50% mark of the bullish CRT.

DXY 1H – Potential Sweep Before Uptrend ContinuationThe Dollar Index recently closed above a previous lower high, signaling a possible bullish trend continuation. However, the recent drop has only seen wicks covering the higher low, suggesting this may just be a liquidity sweep rather than a true bearish reversal.
📊 Key Observations:
✔ Higher Low Sweep: Current price action suggests liquidity is being grabbed before a potential move higher.
✔ Daily Structure: This move aligns with a possible sweep on the D1 timeframe, meaning a bullish reaction could be imminent.
🔎 Next Steps: Watching for bullish confirmation before taking long positions. If price reclaims support, a continuation toward higher levels is likely.

DXY LONG/BUYBy utilizing Fibonacci retracement levels, historical patterns, , we can formulate a hypothesis that the market might follow a similar trajectory if bullish sentiment prevails.

Dollar milkshake theory is intactLots of people are trained bots against the US dollar. They have an instinctual reflex, saying it’s going up to freeze up into an Ice 9 situation, or inflate away like Weimar Republic. Neither has happened. These npc’s fail to understand that the US export most of those dollars. There’s more overseas demand for dollars that native demand. This keeps the inflation in the States at bay, and makes it impossible in the end for any other fiat to compete. We’re watching this play out in the charts with the Euro and the Canadian dollar. The euro is playing footsies with parity to the Dollar, and if parity cannot be stabilize between the pair, the Euro is destined to collapse against the dollar. All of this is in the apparent and what I’m reading into the candles. It’s not witchcrafts

Dollar Bullish To $118?!During the last market analysis I said I remain bullish on the DXY for the upcoming future & that bias still remains the same. After the strong bullish rally from October - December 2024, The Dollar started off this year with an ease off, seeing prices drop for the first quarter of 2025. However, this cool off has not changed the long term perspective for the Dollar as we still remain bullish. This correction (sell off) this quarter was simply a dip.
The Dollar has completed its Wave D consolidation phase & is now getting ready for further upside towards Wave E. Wave E being priced around $116 - $118.

Hope you sold DXY and still selling?This dxy really tested my resolve this week. I was expecting this sell on Wed and Thurs because I have no other objective to the upside as I said in my previous post. But it continued ranging and in that range I lost money. Reason been I was breaking even, entering again since I thought it was a sure move and stopped out many times. It made me also lose my 3 open positions. Now I'm left with just one.
The market can be irrational more than you can remain solvent.
It is okay to reduce risk, it is okay to wait for higher timeframe confirmation.
What is not okay is rushing into a trade and losing money even when you're right.
My objectives for the downtrend are highlighted on my chart. Look at them, I will also update you when I see a possibility of a retracement.
Follow me as most of my trades are market order and not just lines on chart. You will be able to see them on time and trade them with me.

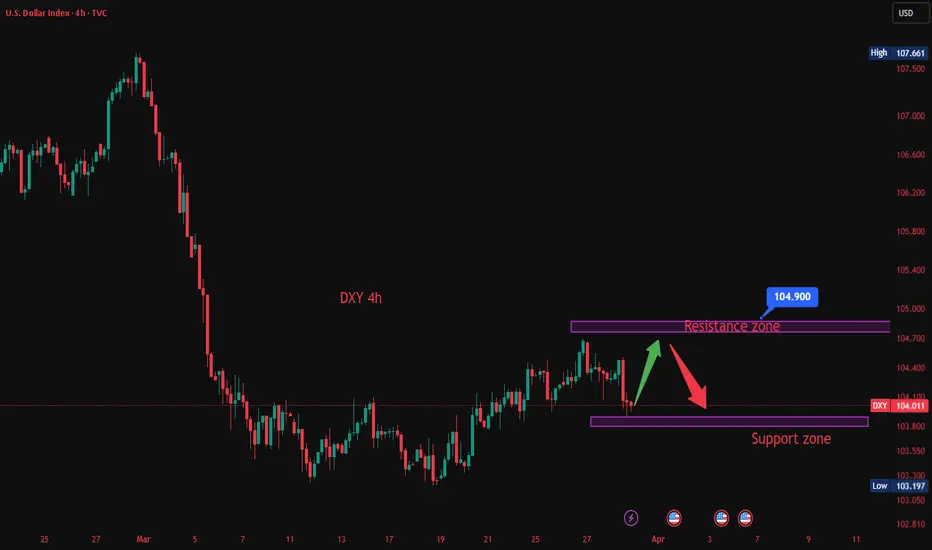
Dollar Index 4hr analysisContinuing our scenario analysis and forecast on the weekly and daily timeframes, here are the reasons for which we believe that at the moment the most likely scenario to play out is scenario 1 (dollar strength), from now on or soon:
1. the flat most likely to play out in the daily is a regular flat (dark blue) because the flat inside it (light blue) is the one that looks most proper, or "ideal", as it has a perfect correction inside it to mark the b wave (marked by a circle, both on the chart and on the macd).
2. the contracting flat that you can see in part 2 of our daily analysis, is a terrible looking correction because even it it were a contracting flat, still the b wave inside it should be the most corrective piece, and it isn't.
3. there is growing divergence on the way down in this last move down on the 4hr, which indicates a potential turn.
Please follow us if you feel that our analysis or setups can be of help!
Thank you for viewing.
