🇺🇸 Today's U.S. Data: Tariffs Starting to Bite?U.S. Data Journal – July 3, 2025
Today's U.S. economic releases showed a stronger-than-expected labor market, with Non-Farm Payrolls (NFP) surprising to the upside, alongside increases in factory orders and a solid ISM Services PMI print.
The combination of these indicators points to persistent demand strength across both goods and services. Moreover, the upward trend in factory orders and service sector activity suggests that tariffs are beginning to feed into cost structures, adding inflationary pressure from the supply side.
While the labor market remains resilient, the risk is that sticky input costs—partly tariff-driven—may complicate the disinflation narrative and potentially delay any dovish policy shift from the Fed.
USDX trade ideas

The bearish momentum is evident on the 1-hour, 4-hour, and dailyThe DXY is likely to continue its bearish trend until it reaches the 94.46 level—and it may even break below that

WHy is everyone Freaking out over the DXY !?!?!Here is a chart of the DXY. with a linear regression channel plotted over it. Yes, we are close to the bottom of the channel. But we are no where near an all time low. Far from it. The DXY may be due for a push, but even if it was to drop more it would not be that big of a deal relative to historical patterns.
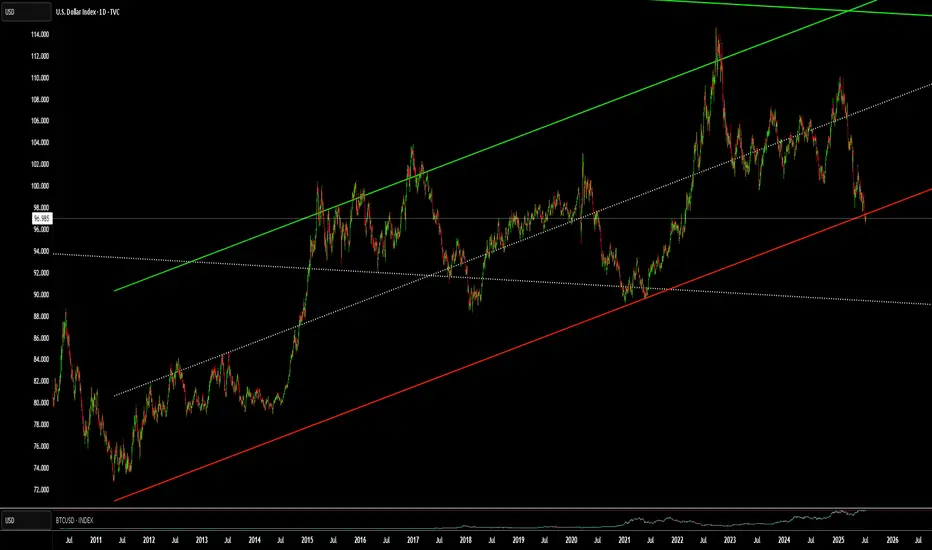
Dollar about to lose 35% of its value in the next 5 yearsDXY testing its last support line before the slide into a steep value crush.
What's another 5 trillion added to the debt anyway? Billionaires need more tax breaks!

The end of the downward trend for the dollar index on the stockAccording to market structure, a new bullish trend is approaching. The stock market clearly reflects the overvaluation of its main exchanges. Everything seems to indicate that there will be news about the Fed's strengthening of interest rates. Something will happen. Long-term entries for USDXYZ assets, and short XYZUSD. MY POINT OF VIEW ON THE STOCK MARKET.

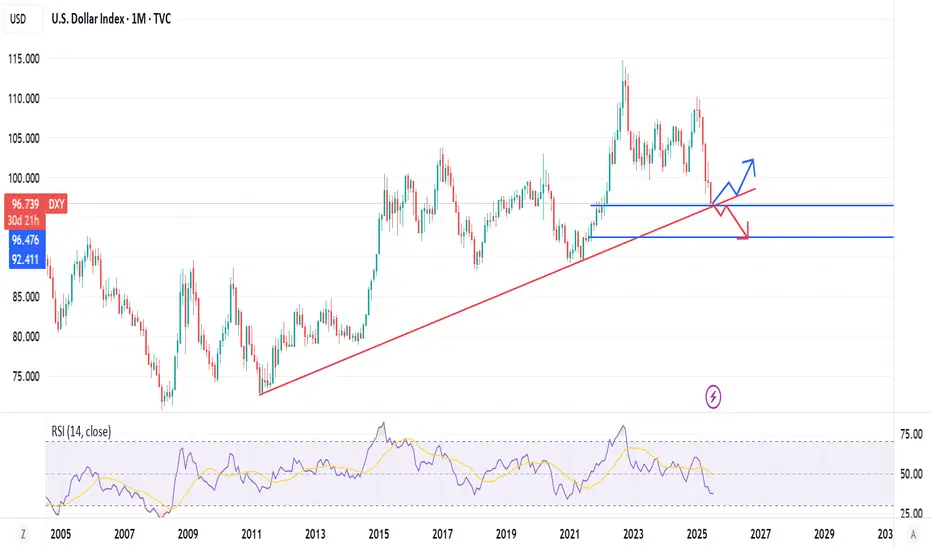
Long-term view for DXY!The current market sentiment isn't favorable for the dollar, but it still presents a good buying opportunity for long-term investors—especially for those looking to purchase USD from exchanges without using leverage or taking on trading risks.

Relation between DXY BTC TOTAL#📄 Analysis of three price charts and comparison between dates and movement
◀️ So far, the anticipated rise in alternative currencies has not occurred, and the rise that has happened is considered small and weak since the bottom of 2022
📄 In the first price chart, we see the movement of the US Dollar Index (DXY)
🔽 Each time the index breaks below the 100.00 level, it has a path to test 90.00, and this path has been achieved twice before during the periods of 2017 - 2018 and 2020 - 2021, with each time lasting approximately 320 days
◀️ At the moment we are in, there has been a break below the 100.00 level in DXY, and we are currently on day 84 of this break
⭕️ In the first break between 2017 - 2018, Bitcoin moved up by 2128%, and alternative currencies moved up by 3030%
⭕️ In the second break between 2020 - 2021, Bitcoin moved up by 608%, and alternative currencies moved up by 1668%
⭕️ In the current third break, which is still in its early stages, Bitcoin has moved up by 48%, and alternative currencies have moved up by 23%
⌛️ This period may extend into the first quarter of 2026, and it is essential to monitor developments closely with daily and weekly follow-ups


dxy looks on critical juncture dxy looks on critical juncture consolidation near 95 can lead to higher side but if it do not happen than lowerside can be the target
The DXY looks doomedI drew this chart in September 2022. Now, almost three years later, the DXY has broken below its channel.

DXY This is a strong increase in short positions (more than double).
DXY Sentiment: Bearish
Momentum: Increasing bearish pressure
(Speculators are more confident the dollar will weaken)

DOLLAREXACTLY AS FORECASTED FROM MY WEEKLY DOLLAR CHART,ON STRONG NON-FARM DATA DOLLAR RISE TO KEEP GOING HIGER,GOLD SELL,AUDUSD SELL ,EURUSD SELL GBPUSD SELL.
Average Hourly Earnings m/m
0.3% 0.4% —
Non-Farm Employment Change
147K 111K 139K
Unemployment Rate
4.1% 4.3% 4.2%
Unemployment Claims
233K 240K 236K
Interpretation and Implications
Average Hourly Earnings m/m:
Rose by 0.3%, slightly below the forecast of 0.4%. This suggests wage growth is steady but not accelerating, which may ease some inflation concerns.
Non-Farm Employment Change:
The US economy added 147,000 jobs, beating both the forecast (111K) and the previous month (139K). This indicates continued, though moderate, labor market expansion.
Unemployment Rate:
Fell to 4.1%, better than the expected 4.3% and down from 4.2% previously. This points to a modest improvement in labor market conditions.
Unemployment Claims:
Dropped to 233,000, lower than both the forecast (240K) and last month (236K). This signals fewer new layoffs and continued resilience in the job market.
Market Impact
Dollar (USD):
The combination of stronger-than-expected job growth and a lower unemployment rate is generally supportive for the US dollar, as it suggests the labor market remains robust. However, slightly softer wage growth may temper expectations for aggressive Fed tightening going forward.
Federal Reserve Outlook:
These figures reinforce the Fed’s “data-dependent” stance. Solid job creation and falling unemployment reduce urgency for immediate rate cuts, but the lack of wage acceleration may allow the Fed to maintain a cautious approach.
In summary:
The US labor market in July 2025 shows moderate strength, with job gains and a falling unemployment rate, while wage growth remains steady but not excessive. This mix supports a stable outlook for the dollar and gives the Fed flexibility in its upcoming policy decisions.

DOLLAR INDEX BY 1;30 PM we are expecting the average hourly earnings m/m with a forecast 0.3% and previous 0.4% and Non-Farm Employment Change forecast 111K below past data of 139K
the rate of Unemployment is forecasted to be lower as monetary team is looking at 4.3% against previous data of 4.2%
but yesterday ADP -33k have given a clue that Non-farm data will come soft which will trigger sooner rate cut by feds.
dollar index and US10Y will be watched to see the direction of investment by investors.
if NON FARM EMEPLYMENT CHANGE AND UNEMPLOYMENT DATA REPORT COMES GREATER THAN FORECAST, DOLLAR AND US10Y WILL RISE AND WE SHORT GOLD ,AUDUSD SELL,GBPUSD SELL,EURUSD SELL ,USDJPY BUY.
THIS IS JUST FOR EDUCATIONAL PURPOSES ONLY.

Why I haven't posted this week:Hey all,
So, for those of you who watches my videos and market commentary will have noticed that I haven't posted anything this week, event though there were some awesome opportunities to highlight and discuss.
The reason for this is because I am currently conducting work training and was unable to record, however, rest assured that I'll be back next week to break down these markets with you and take advantage of the opportunities lining up.
Up until then keep well and bye for now

DXY LONG 03/07/2025Here we have the DXY hitting the resistance of a multi-year confirmed tunnel, while the down trend seems very strong, and can break trough some more to the downside, its a good spot to start picking up some UUP stocks, I belive price will eventually break and hit the 93 price mark, will make a double bottom and run back up inside the channel.
Good luck

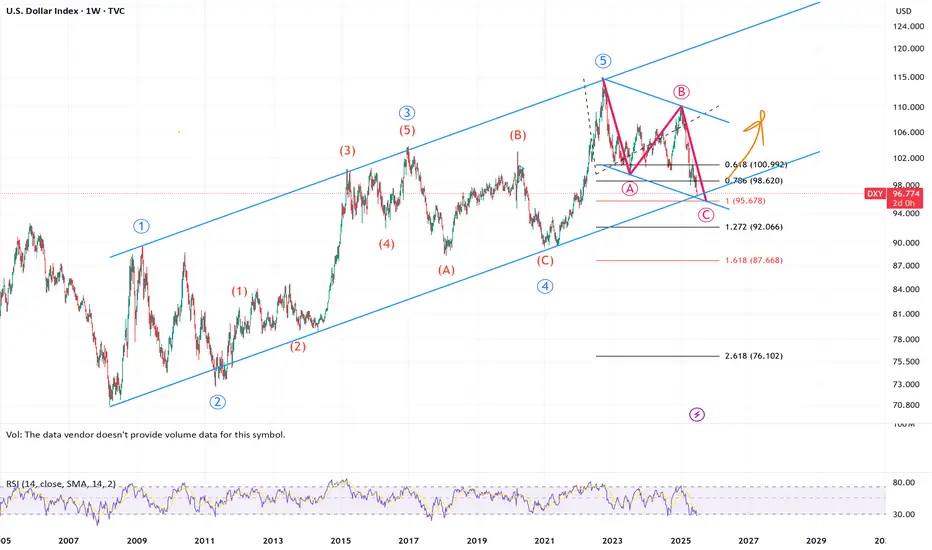
USD weaknening is coming to an end?DXY is soon reaching a 1:1 second leg down (measured at 95.678).
Similarly, EURUSD is reaching a 1:1 since the Sept 1 (2022) low (measured at 1.2046).

USD Tries to Break the Tide at NFPIt's been a painful week and a half for the USD.
Around the June FOMC meeting a hopeful bounce had built as the Fed sounded a bit less-dovish. While inflation remains below their expectations the labor market had held up relatively well, and with the threat of possible inflation from tariffs they didn't seem to be in any hurry to cut rates.
But then last week opened with Michelle Bowman saying she supported a rate cut as early as July, and DXY put in a bearish engulfing pattern. And then into the end of Q2 it was constant bleeding as the currency continued to trip down to fresh three-year lows.
Interestingly, the shocking miss on ADP data this morning illustrates weakness in the labor market, yet the USD is currently showing its first green day since last week's open.
This is likely more due to just how oversold the currency has become but it sets the stage for NFP tomorrow. While that data point is a major driver, it's supply and demand, which is denominated by positioning, that pushes prices. For tomorrow the interest is in a better-than-expected NFP print bringing a short-term squeeze in the USD, after which markets will get a look to see just how aggressive bears remain to be. The big area of interest for this is the prior swing low, at the 97.91 level, which set support in April and then held the lows in June, until the late-month breakdown move.
To date that spot still hasn't been tested for resistance and if sellers do get a chance to offer at that level, we get to see how aggressive they remain to be. - js

DXY USD Dollar Bearish Short term, then bullishI am not a financial advisor. This is not meant to be and does not constitute financial, investment, trading, or any other types of advice or recommendation.

U.S. dollar index DXY analysis- daily time frame ✅ U.S. Dollar Index (DXY) Analysis — Daily Timeframe
👤 A TVC:DXY trader’s perspective:
When I look at this chart, several key points immediately stand out:
1️⃣ Long-Term Trend
On the weekly and daily timeframe, the major trend has turned bearish after peaking around 114. We see a clear series of lower highs and lower lows confirming the downtrend.
The sharp rally from 89 to 114 in the past was a strong impulsive move, which is now undergoing a deep correction. Currently, price is hovering around a major historical support near 96.
2️⃣ Key Support Zone
The current price near 96.7 is sitting right at a significant support area that has triggered considerable buying interest in the past.
If this support decisively breaks, the green zone marked as DD (around 93–95) represents a strong long-term demand zone and will likely be the next liquidity target for buyers.
3️⃣ Resistance (Supply Zones)
The four red-marked 4HR zones between 97 and 101.9 clearly show significant supply zones where sellers have stepped in on lower timeframes.
Should the price attempt a bounce from current levels, these resistance areas may act as a strong barrier to further upside.
4️⃣ Price Structure and Liquidity
Looking more closely, the market seems to be moving from a consolidation phase toward lower support liquidity. That means there is a high probability of a liquidity grab toward the 93–95 area before a potential fresh bullish leg.
At higher levels, unless the price can break and hold above 98 and then 100, we cannot confirm a trend reversal.
🔹 Summary
✅ Overall downtrend remains dominant
✅ 96–97 is a critical support zone
✅ A break below this support targets 93–95
✅ Trend reversal only possible with a confirmed break and hold above 98, and then 100–101
✅ The 4HR resistance zones (97–101) are strong hurdles for any bullish retracement
✅ As long as price remains below 98, any rally is likely just a corrective move
⚠️ Disclaimer: This analysis is for educational and informational purposes only and does not constitute financial advice or a recommendation to buy or sell. All trading decisions are solely your own responsibility.

USXUSD LOTWUSXUSD LOTW Potentially In.
H1 BOS confirms this for me. Targeting H4 Internal Liquidity & Daily FVG.
Let's see.

I would be looking for reversal patterns on the ES and the Russe7 1 25 I made a few mistakes naming some of the markets but if you can deal with that then I explain what my concerns are regarding some of the patterns. most of the trades that I posted as trading opportunities have moved higher and did not require large stops. I spent time on a certain pattern that I don't really talk about but it influenced my Trading and gives me caution not to stay in a market to Long.... and I tried to use the the gold and the silver because I really am tied into those markets and I'm concerned about a pattern on the gold that is actually giving a signal to be long but I'm still concerned about it and I tried to articulate that in the video.... it's about the concept of what that pattern represents to me..... and incorrect or the market trades differently it's not a big deal..... the irony in the video is that I tried to show that pattern thinking that I was in a certain Market and I had the wrong Market..... the only thing I would say is there's a certain pattern and they think Gold's a very good example and will give me a chance to talk about it in a couple of days and I want to see if it actually can make a new high which I am concerned about because I want that new high to sell some of my goal but I want a good price and it's a large amount.... and I'm not doing this to be egotistical or trying to prove a point.... I'm willing to show something that's actually going on and I'm willing to talk about it. a number of people are entering in my trades which is perfectly fine and they try to make statements in my videos that require that you go back and reevaluate those videos to see what happened and that's the best way to learn. I stopped looking at other people's charting mostly because I'm happy with what I do but also when people chart something and project a Target but never do anything else to help you determine if that projection was correct that's not of any value. if you can find somebody who finds an entry and tells you what it is or that it's about to happen and that person does a video on it which he cannot change so that even though you don't see the actual trade the market trades in the direction and has reversals that are outlined before they happen that's the best way to trade it completes the cycle of trading.... and the beautiful thing is if you post it you can't erase it.... that's how you can learn effectively if you go back and create the patterns that were shown to you previously.

DXY TURNS BULLISH, SELL EURUSD, GBPUSDDxy is now bullish, I said it last week and I'm saying it again. Nothing has changed, this means we sell EURUSD, GBPUSD etc.
I publish DXY chart because it shows what im expecting in other dollar pairs without having to publish them.
Follow me as my trades are market order, so you will see it on time and enter on time
