ANH breakup coming?ANH has been consolidating within a box formation for the last 90 days and is now looking to attempt a breakout above the R1110.00resistance level
A solid close above this R1100.00 level with confirm the breakup which opens up targets to retest R1220.00
1NBA trade ideas

$BUD on the weeklyWeekly potential for IHS (inverse head and shoulders) plus Billy Gates just bought in $95 million

Pair trade idea: ANH to outperform BTI?A price action above 1.7270 preference ANH to outperform BTI.
The target price is set at 1.7880. Its 50% Fibonacci retracement level.
The stop-loss price is set at 1.6725.
Remains above its 200-day simple moving average, confirming a natural bias for ANH to outperform BTI.

BUD triple bottomThe graph is forming a bullish triple bottom which may lead to a major outbreak through the resistance level of 53.88 euro. The next couple of days will be interesting to watch.

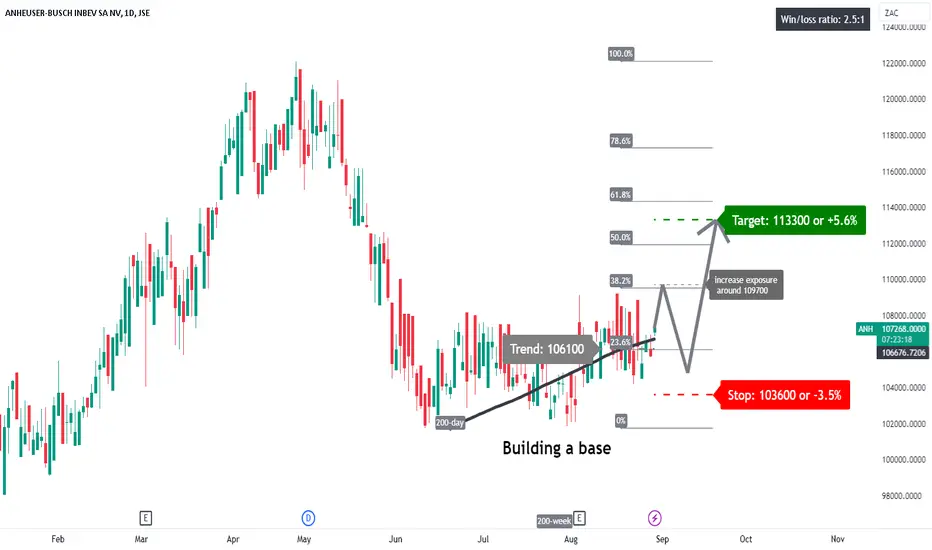
ANH: crossing above its 200-day simple moving averageA price action above 106100 supports a bullish trend direction.
Further bullish confirmation for a break above 109800.
The target price is set at 113300.
The stop-loss price is set at 1036000.
Crossed above its 200-day simple moving average, which might set the long-term trend as bullish.
Building a base. The bigger the base, the bigger the space.
Short Term Value PlayAlright folks !
This could be a safe ride to upside in a short period of time.
regards :
The Goat Himself

BUD - Large upsideAnheuser-Busch InBev SA/NV, commonly known as AB InBev, is a Belgian multinational drink and brewing company based in Leuven, Belgium and is the largest brewer in the world.


July Trades (BUD, account down 0.37%)7th day trade in July is NYSE:BUD on 7/20/2023.
Account is down 0.37%.
Total return in July is 7.61%.

Can BUD recover? LONGBUD trended down in the social media fiasco until June 1st and then reversed.
Based on long term VWAP lines ( mean and standard deviations) anchored to April 1st
on the one hour chart, BUD is crossing over VWAP lines from below and is now
approaching the mean VWAP at 59.25. It could make a bullish move and cross the
mean VWAP or it could bounce down if short sellers dominate buyers and longs closing
their positions. The dual time frame RSI shows both low time frame and high time frame
strength over 50. The three in one indicator shows money flow and momentum to also
be bullish. My call options expiring 12/15/23 striking $55 are up 23% since July 1st. This
is reasonable unrealized profit for the risk taken. I see BUD with more upside potential
than downside risk. I will take more call option contracts for $65.00 at a premium of
$195.00. they have appreciated 15% in the past 24 hours. This is a conservative low beta
low risk options trade. Buy low, sell high !

$JSEANH - AB InBev: It Has Dipped, Buy The Dip!The last analysis of the brew master was on 30.03.2023 and the call was to buy the dip as there is more upside ahead.
The share rallied a bit more thereafter and hit a peak at 123201 and has since dipped just under 15% to 101740.
Whether or not this is the low is hard to say but trading is all about taking risk with uncertainties.
The MACD on the daily timeframe has already given a buy signal.
Aggressive traders can use 101740 as a stop-loss level if they enter now.
Conservative traders can wait for more confirmation signals.

ANH Now Overstretched, Reversal ImminentIn week 25, ANH has had a good run, now overbought up to the monthly timeframe is due a pullback into failed daily cycle then weekly cycle low. Price is poking at the resistance of the Keltner Channel at a level where there is horizontal resistance, usually double convergence of resistance is too hard to overcome in overbought conditions. The share now presents a short opportunity

Ab InbevJSE:ANH back below the previous resistance level. The previous long trade idea is now invalidated; our stop was hit few weeks ago at break-even.
Might be a good setup for a short position targeting R800 (a worse case scenario for the stock).

BudweiserNo reason to be long #Budweiser since 2016.
You never know how long the bear market will be.
See the price contained by trendlines and Ichimoku clouds.

BUD - BEARISH CONTUNUATIONAnheuser - Busch Inbev started reverse capitalization of their last marketing adventure, and the controversial directions taken by the head of marketing caused a single red day to erase nearly $4 billion market cap. Unfortunately for BUD that was not just a single-day event, the decline is still going down on a steep angle. The vacation season in the US already kicked off to rock a possibly warmer-than-usual summer and many drinking venues are done choosing the seasonal promotions and POS arrangements. This is all happening at the wrong time, during the wrong time for BUD. What they say about "the bottom of every bottle" is very valid for Bud Light and Budweiser beers.
Risk Disclosure: Trading Foreign Exchange (Forex) and Contracts of Difference (CFD's) carries a high level of risk. By registering and signing up, any client affirms their understanding of their own personal accountability for all transactions performed within their account and recognizes the risks associated with trading on such markets and on such sites. Furthermore, one understands that the company carries zero influence over transactions, markets, and trading signals, therefore, cannot be held liable nor guarantee any profits or losses.

BUD Anheuser-Busch InBev Options Ahead of EarningsIn April, Anheuser-Busch InBev ran a social media campaign for Bud Light beer that featured the transgender influencer Dylan Mulvaney . The company is currently facing the consequences of this promotion, and it is likely that their beer sales will significantly decline in the current quarter.
Now analyzing the options chain of BUD Anheuser-Busch InBev prior to the earnings report this week,
I would consider purchasing the 50usd strike price Puts with
an expiration date of 2023-12-15,
for a premium of approximately $1.30.
If these options prove to be profitable prior to the earnings release, I would sell at least half of them.
I am interested to hear your thoughts on this strategy.

Boycott Consolidation Range BreakoutFollowing the boycott of Anheuser-Busch's Budlight, it dropped initially, then went sideways from there. The consolidation range is now broken and I believe it is going down.
Seeing social media, I don't see this boycott ending anytime soon, many people choose not to drink the beer for life. A few extend on to boycotting other Anheuser-Busch products too. Budlight alone makes up about 16% of the company's global revenue and more than 20% in the US specifically just for context.

BUD - Hail the King of BeerHere on a daily chart, I have plotted the ratio of the dynamic share price of BUD compared
with TAP. The thesis is that TAP ( Coors / Molson) may have had a share price rise while
BUD dropped its own as a reaction to its adverse ad campaign which resulted in a social media
disaster. BUD is global with only 25% of its market in North America while TAP is more like
North America predominantly. The ad campaign and social media backlash is only North
America over time is impact will be nil.
The thesis is that BUD will recover and that astute contrarian investors and traders can profit
from the dynamic which in the greater and longer picture has been a dip for BUD representing
a buying opportunity. As can be seen on the chart, the DUD/TAP ratio is at the bottom and
outside of the boundary of the lower Bollinger Bands and now reentering the bands.
The ratio is also in the demand/support zone where it was last October. The action
of the ratio was a double top "M" pattern which has now played out . Finally, the AI predictive
algo of Luxalgo predicts a ratio rise between now and the end of the month as the ratio
heads to the midline of the Bollinger Bands. Overall, the analysis is that either BUD will rise
or TAP will drop or some combination. Overall, I conclude that BUD could easily rise from
this dip over the next ten calendar days. I will take a position in call options with 30- 45 DTE.

BUD reversal begins in the next week or so...Though I wish it weren't so, the chart makes me believe that BUD will have a reversal that begins within a week or two.
Initial price level of $61.70 in mid-June, with $61.81 and $62.88 tests around late-June/early-July if $61.70 level is forcefully broken.
The stock appears to have been oversold.
Hitting the bottom of the LuxAlgo channel.
Major oscillators (e.g., MACD, RSI, etc.) appear to be cresting at their bottoms and starting their turnaround toward positive acceleration.
"Woke" whales still have a vested interest to do what they can to keep the soon-to-be zombie corp from failing quickly, so they will try and save it.

EXPLAINED: Calculation for CFD Brokerage with Anheuser ExampleHow do I calculate the brokerage I'll pay on a local CFD trade?
You’ll need to calculate the brokerage you’ll pay to enter your trade and the brokerage you’ll need to pay to exit your trade.
We’ll first need to lay out all the necessary information to calculate what brokerages you’ll pay…
For this example, we’re going to use a trade example with Anheuser Busch InBev.
And we’ll use the brokerage of 0.30% leg in (entry) and 0.30% leg out (exit) to pay.
Here are all the specifics needed for this trade:
Portfolio value: R40,000
Trade: JSE:ANH
Type: Long (buy)
Brokerage rate in: 0.30%
Brokerage rate out: 0.30%
Entry: R1,184.00
Stop loss: R1,143.00
Take profit: R1,215.00
Calculation #1: Calculating your ENTRY brokerage with CFDs
Step #1: Know what your max portfolio risk is per trade
Max % risk = (Portfolio value X 2%)
= (R40,000 X 2%)
= R800
Step #2: Find out the rands risked in trade
Rands risked = (Entry – Stop loss)
= (R1,184.00 – R1,143)
= R41.00
Step #3: Calculate the number of CFD contracts to trade
No. CFDs = (Max % risk ÷ Rands risked)
= (R800 ÷ R41.00)
= 19.51
SIDE NOTE: We always round down the number of CFDs, so that we risk less than what we choose to risk instead of more.
Therefore, we will buy 19 CFDs in this specific trade.
Step #4: Calculate your ENTRY exposure for the CFD trade
Entry exposure = (Entry price X No. CFDs)
= (R1,184 X 19 CFDs)
= R22,496
Brokerage in = (Entry exposure X Broker rate in)
= (R22,496 X 0.30%)
= R67.48
This means, you’ll need to pay a brokerage of R67.48 in order to buy (go long) 9 Anheuser CFDs.
Now we can move onto the next brokerage leg.
Calculation #2: Calculating your EXIT brokerage with CFDs
Step #1: Work out your EXIT exposure for the CFD trade
Exit exposure = (Exit price X No. CFDs)
= (R1,215 X 19 CFDs)
= R23,085
Step #2: Calculate your brokerage leg out
Brokerage out = (Exit exposure X Broker rate out)
= (R23,085 X 0.30%)
= R69.25
Step #3: Calculate the total brokerage for the CFD trade
Total brokerage = (brokerage leg in + Brokerage leg out)
= (R67.48+ R69.25)
= R136.73
This means, if the trade hit your take profit level you would have ended up paying a total brokerage of R136.73 for your Anheuser CFD long trade.

BUD Uptrending despite the Bud Lite controversyBUD is a staple stock catering to beerdrinkers both in North America and Europe.
The controversy about a spokesperson for an ad campaign for Bud Lite has heightened awareness.
Bud Lite is only one product of the parent company.
Fundamentals arise, BUD is uptrending since Friday the 13th with hull moving averages converged.
In confirmation, the RSI bottomed at 25% and is now rising while the volume indicator shows
increased volume as compared with that of March.
Overall, I see BUD as a good investment in a recessionary environment because if anything
history shows alcohol consumption increases in a recession. If production costs can be
contained despite inflation and demand goes higher so will those earnings and the market cap

BUD (daily) is undergoing some transitionIn a free fall. A Mulvaney moment. Target 60 should be a good resting place, as there is ample support. I'm not interested, I prefer real beer.

ABINBEV ready to break up and beyond to 76.38Scallop pattern has formed on the daily.
It hasn't created the pattern fully and a breakout is important to wait for.
The problem is before the Scallop there was an extended Rectangle pattern with a little range.
This box formation could take place again as companies tend to have their own trading personality.
Until the breakout occurs, it's a risky position to be in.
7>21>200
RSI>50
Target 76.38
ABOUT THE COMPANY
AB InBev (Anheuser-Busch InBev) is a multinational beverage and brewing company headquartered in Leuven, Belgium.
The company was formed in 2008 through the merger of Belgium-based InBev and American-based Anheuser-Busch.
AB InBev is the largest beer producer in the world, with a portfolio of over 500 beer brands sold in more than 150 countries.
Some of the company's most well-known brands include Budweiser, Corona, Stella Artois, and Beck's.
The company has a market capitalization of over HKEX:160 billion (as of April 2023).
AB InBev has 155,000 employees worldwide and operates 170 breweries across the globe.
The company is known for its aggressive acquisition strategy, having acquired several major beer companies over the years, including SABMiller in 2016.
