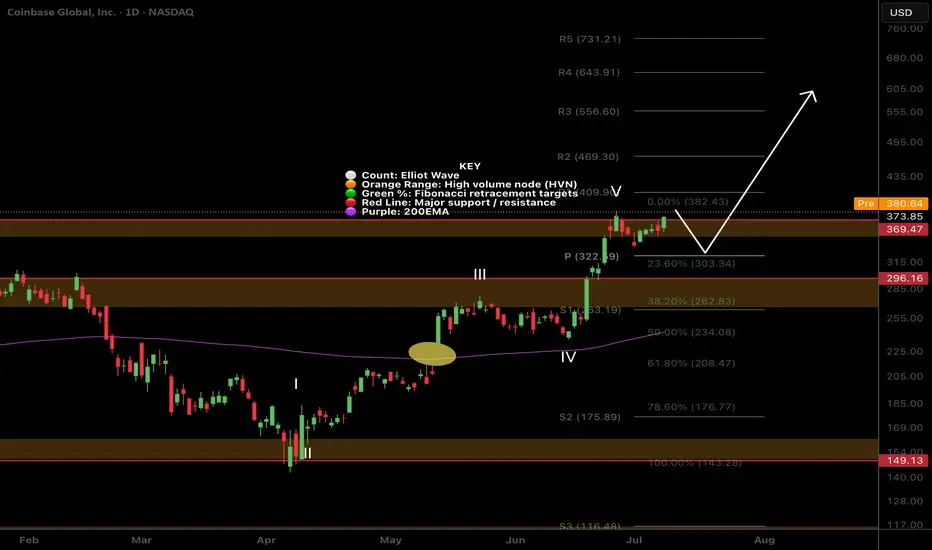
COIN long -- currently in Wave 3 of 5 wave advance I've been using Elliott Wave Theory to look at COIN's price action. We seem to be in the middle of Wave 3.
- Wave 1: April 7, 2025 to May 22, 2025
- Wave 2: May 23, 2025 to June 13, 2025 - we pulled back right below the 23.6% Fibonacci retracement level with ~$244 serving as support.
- Wave 3: June 14, 2025 - now. The third wave usually has 5 distinct sub-waves. As of July 7, 2025 We appear to be in the 3rd sub-wave of wave 3. Using the upper channel line, price target for this wave is around $408-$410. Quite possible if we see BTC move up explosively, which also seems imminent given the highest weekly close on July 6, 2025.
COIN is a very volatile stock that has explosive moves to the up and downside. I think we still have more room to run in this current wave 3--even beyond sub-wave 1 peak at $380.
1QZ trade ideas

Coinbase (COIN) Shares Reach All-Time HighCoinbase (COIN) Shares Reach All-Time High
According to the chart of Coinbase Global (COIN), the share price of the cryptocurrency exchange has reached a historical all-time high (closing price).
The bullish sentiment has been supported by the following factors:
→ Bitcoin price rally. Yesterday, we analysed the BTC/USD chart and anticipated that bulls might attempt to set a new record. Following the publication, Bitcoin made a strong upward move, breaking above the $118,000 level.
→ Passage of the GENIUS bill in the US , which establishes a regulatory framework for the use of stablecoins.
Can COIN stock continue to climb?
Technical Analysis of Coinbase (COIN) Share Price
At the end of June, our analysis of the COIN chart highlighted the following:
→ From a broader perspective, COIN’s price fluctuations over the past year had formed an ascending channel (marked in grey).
→ The ongoing intermediate rally (marked in blue) had the potential to drive the price towards the upper boundary of this grey channel.
This scenario has materialised: today, COIN shares are trading near the upper edge of the grey channel. However, several factors now warrant a bearish outlook:
→ The upper boundary of the channel may act as resistance;
→ The psychological level of $400 could also serve as resistance;
→ Shareholders may be tempted to lock in profits;
→ A potential bearish divergence on the RSI indicator.
It is possible that in the near term, COIN bulls will attempt to break through the $400 level. However, if buying momentum weakens, the conditions may favour a price correction — which would appear justified after a nearly 60% rally since early June.
This article represents the opinion of the Companies operating under the FXOpen brand only. It is not to be construed as an offer, solicitation, or recommendation with respect to products and services provided by the Companies operating under the FXOpen brand, nor is it to be considered financial advice.

Bullische Formation - Tassen mit HenkelKey Takeaways:
* Coinbase receives massive support from the Trump administration
* New all-time highs reached
* 50% year-to-date performance
* Strong position in the regulated US market
Valuation: The stock currently appears overvalued, but with political tailwinds.
Outlook:
* Short-term: Continuation of the uptrend due to the Trump effect
* Medium-term: Dependent on regulatory developments
* Long-term: Growth potential through mainstream crypto adoption
Potential Catalysts:
* Implementation of the strategic crypto reserve
* Regulatory clarity
* Institutional adoption
* Bitcoin ETF success
Strengths:
* Market leadership in the US
* Regulatory compliance
* Strong brand
Challenges:
* Cyclical dependence on the crypto market
* International competition
* Regulatory risks
Where it's doing well:
* Institutional services
* Regulatory compliance
* US market share

$COIN – Smart Money Lining Up a $400 Magnet?📈 NASDAQ:COIN – Smart Money Lining Up a $400 Magnet?
Narrative:
After a clean BOS (Break of Structure) and multiple CHoCHs (Change of Character), NASDAQ:COIN has reclaimed premium territory with precision.
What’s more telling?
➡️ The recent low-volume accumulation followed by a sharp breakout into the prior supply zone.
📌 The entry zone (highlighted) was surgical—likely smart money loading long exposure just below $365.
You don’t get that kind of entry without intent.
🔍 Technical Highlights:
Price reclaimed the weak high and flipped it into a potential continuation breakout.
Next clear magnet = $400 psychological + liquidity level
Volume behavior = “low-volume push” → likely testing market’s willingness to chase momentum.
🧠 AI System Insight:
While my LSTM model initially flagged this zone as exhaustion (which led to my prior failed put play), options flow and structure now confirm:
→ The market is likely rotating toward bullish momentum.
"Look at that entry… they’re probably gonna take this to $400."
⚠️ Watchlist Considerations:
Volume surge + price above $380 = confirmed squeeze
Failure below $365 = trap → back to EQ or discount zones
Options traders are bidding → flow supports bullish continuation
📌 I’m not in this trade yet—but watching for either a breakout confirmation or pullback retest for entry.
Don’t fade the strength unless you see absorption + reversal candle.
—
Prabhawa Koirala (Pravo)
Founder – WaverVanir International LLC
#COIN #SmartMoneyConcepts #OptionsFlow #Breakout #LSTM #VolumeAnalysis #WaverVanir #TradingViewIdeas
Analyzing the Bearish Trend in $COIN with AI & Smart Money Insig📅 Posted on July 8, 2025 by WaverVanir International LLC
Today, our advanced predictive model highlighted a potential short-term decline in NASDAQ:COIN (Coinbase Global Inc.), leveraging AI-driven forecasts and Smart Money Concepts (SMC) analysis to validate the trend.
📊 Insights from AI Model:
- Current Price: $353.30
- Expected Movement: Decline to $284.67
- Confidence Level: 60%
- Timeframe: 1 hour
📉 Noteworthy Observation:
- VolanX Alpha Layer detected a significant -19.42% probability spike.
📉 SMC Analysis Overview:
- Identified distribution pattern in premium zone
- Rejection of weak high levels
- Anticipated liquidity gap below equilibrium point ($306.10)
- Imbalance in volume profile awaiting resolution
🧠 Key Takeaway:
The alignment of AI predictions and market structure signals a substantial institutional impact. WaverVanir remains proactive in the face of volatility, strategically reallocating resources based on high-probability scenarios.
⚠️ Risk Advisory:
Kindly note, this information is not financial advice but derived from our internal Decision Support System (DSS) and AI technologies. It is essential to prudently manage position sizes and account for potential scenario variations.
📡 Connect with WaverVanir for further insights into market dynamics, strategic signals, and structured trading approaches.
#WaverVanir #COIN #VolanX #SmartMoneyConcepts #AITrading #InstitutionalEdge #MarketStructure #LinkedInFinance #TradingAI #DSS #LiquidityHunting

COIN Breakout Loading: Smart Money Reclaim Underway | WaverVanir🚀 COIN Breakout Loading: Smart Money Reclaim Underway | WaverVanir Alpha Alert
NASDAQ:COIN just tapped a deep discount zone, rebounded from the 0.5–0.618 retracement band, and is now reloading liquidity under the previous high.
⚙️ Technical Breakdown:
✅ Fibonacci Golden Pocket (0.618 at $384.67) was respected with strong wick rejections.
🧠 Volume compression hints at algorithmic absorption under $388.
🔴 Red Supply Block @ $393.91–$395.80 is next liquidity target.
🟡 EMA ribbon acting as dynamic support, stabilizing at $381–$382.
🎯 Target Structure:
🚀 Break $388 → blast through $393.91 (1.236) → ignite options gamma toward $400.19
🔥 Your move, institutions. This is the last discount before markup.
💰 Trade Thesis:
Holding 7/11 $387.5C @ 0.71 – Target Sell @ $1,000 per contract.
Time is short. But so is volatility.
One wick above $393.91 can detonate open interest.
🧠 If this reclaims $388 with a strong candle and volume surge, expect FOMO to carry this into the gamma squeeze zone by EOD.
📍 Posted by WaverVanir International LLC – Quant-Fueled Liquidity Engine | VolanX Protocol Alpha Layer
#COIN #Coinbase NASDAQ:COIN #OptionsFlow #GammaSqueeze #LiquidityRaid #SmartMoney #TradingStrategy #SMC #QuantEdge #FibLevel #WaverVanirAlpha #VolanX #BreakoutTrade #VolumeProfile #BuyTheDip #HighConvictionTrade

$COIN Options Trade Blunder | AI vs. Flow — Who Wins?NASDAQ:COIN – When LSTM Confidence Misfires at the Top
This week I entered puts on NASDAQ:COIN off a 95% confidence signal from my LSTM model, anticipating a bearish reversal near the premium zone.
It looked clean:
🔺 Price had tapped a weak high
📈 Extended rally from discount to premium
🧠 LSTM model flagged a local exhaustion top
But I ignored the bullish options flow.
Institutions were loading calls.
Volatility structure showed strength.
I chose the model. The market chose pain.
📉 Trade Setup:
Short thesis: Rejection from premium + weak high
Entry: $370 zone
Target: $325 (mid EQ)
Invalidation: Break above $380
Actual Result:
Price consolidated, then held bullish structure.
Implied volatility stayed elevated. No follow-through on the short.
Loss: ~50% on puts.
💡 Lesson:
Chart logic aligned
AI signal was compelling
But real-time flow > model output
LSTM is 70% of my AI trading system, and I’m now integrating options flow override filters to prevent this kind of mismatch in future signals.
📌 I’m currently risk-off, rotating capital into 5Y Treasury futures ($Z) to cool down, refine logic, and reassess volatility pricing models.
🧠 This phase is experimental. If you’re watching my trades – don’t follow. Observe. Learn from the debug phase.
—
Prabhawa Koirala (Pravo)
Founder – WaverVanir International LLC
#COIN #TradingView #SmartMoneyConcepts #LSTM #AITrading #OptionsFlow #WaverVanir #PremiumZone #QuantTrading #VolanX

COIN Trade Update – July 11, 2025🚀
COIN is climbing with strength, pushing higher inside a rising wedge formation.
Price action is tight but bullish — buyers defending trendline support beautifully.
📍 Entry activated at $388.97 after confirmation near wedge resistance.
🎯 Targets locked in: $393.55 and $399.60
🛡️ Risk managed with stop below $383.00 — structure still intact.
This is a classic breakout anticipation setup with momentum building. Watching closely for volume surge and resistance break. Trade active — bias remains bullish.
🔍 Strategy: Rising Wedge + Breakout Continuation
📊 Sentiment: Bullish Cautious
📅 Holding through the session — price near key breakout level.

$COIN Price discovery?I was looking for a deeper pullback on NASDAQ:COIN but it appears to be heading into price discovery!
The pivot at $322 was my target but sentiment must be bullish if investors are impatient! Still... i wouldn't count out another sell off as a bear trap on a poke above the swing high.
Safe trading
$COIN – Smart Money Short Setup (15m)🚨 Bias: Bearish
📍 Reason: Clean CHoCH + BOS structure break from premium supply zone. Price swept liquidity and rejected equilibrium near 358–359, confirming internal weakness.
🧠 SMC Insight:
Multiple CHoCHs show internal break in bullish structure.
Rejection from equilibrium zone = smart money redistribution.
BOS confirms intent to push toward untapped liquidity below.
📊 Volume Profile:
Spike in red selling volume = aggressive seller interest.
Low-volume node around 351–352 = likely drawdown zone.
Major demand/accumulation zone sits at 337–338 with “Strong Low” tag.
🎯 Trade Plan:
🔽 Entry: 357.50–358.50 (on retest)
❌ Stop: Above 360.00
✅ TP1: 351.50
✅ TP2: 337.50 (major demand)
⚠️ Risk: Moderate
🧠 Tip: Monitor BTC/ETH weakness for confluence.
🧬 Powered by WaverVanir DSS – Institutional Trade Engine
#SMC #Coinbase #COIN #VolumeProfile #LiquiditySweep #WaverVanir #TradingView #SmartMoney #AlgoDriven #Quant #InstitutionalOrderFlow

Coinbase overbought and into massive resistanceI've highlighted a major area of resistance on Coinbase going back 4 years to 2021. Was above the trendline earlier in the week and is now getting rejected. Good short opportunity. Will monitor this one. I just bought some CONI

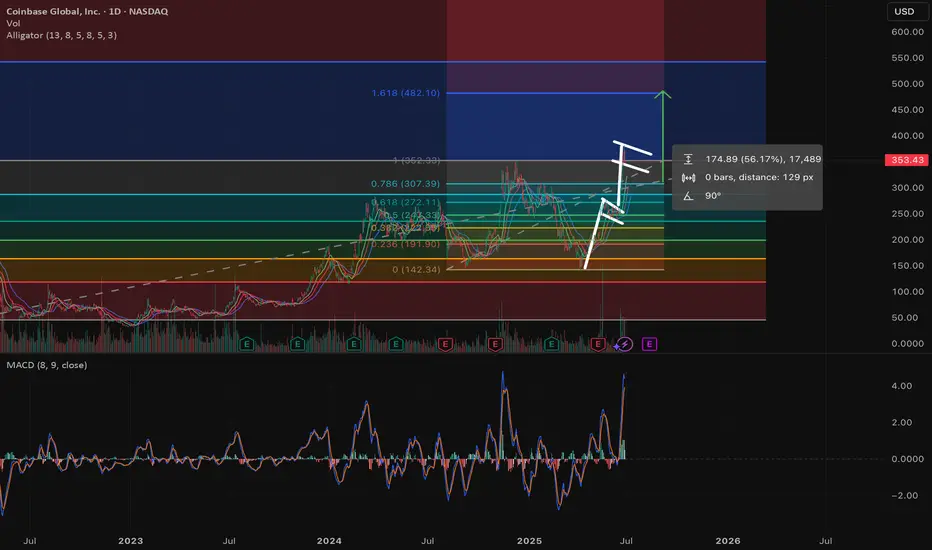
CoinbaseThere isn't much to add to my COIN analysis. Price hit just shy of the 1.618 and then reversed. Price dropped by almost 10% from that last high. This bodes well for the top being in and the irregular (B) wave pattern prevailing. We still have a lot of work to do to prove that is what is happening though. Until we can breach $277 followed by a breach of $232.85, we can't be for certain. Yes, we will have hints on the way down. However, these price points will be what confirms the pattern lower. As I said above, COIN has a lot of work to do to prove its intentions. This last move up I think is largely due to the end of the quarter, congressional legislation, and FOMO.
MACD is back to within the red trend lines and appears to be weakening to the downside. This shouldn't be too surprising given how far we fell last Friday. That move lower, has created a 3-wave move thus far. Another local low before starting a consolidation higher would create a 5-wave pattern bringing more clarity, but it isn't required.
Again, I don't want to see another high made above last Thursdays if (B) is to be correct. A new high itself doesn't invalidate an irregular (B), but it would cause me to become very skeptical of it.
When I said last week that COIN has a pivotal moment right in front of it, I wasn't kidding. It appears to have chosen a move lower for now, but it is not guaranteed to continue and we could always move higher again from here. Just be careful in whatever position you take, and use stops to protect your assets.

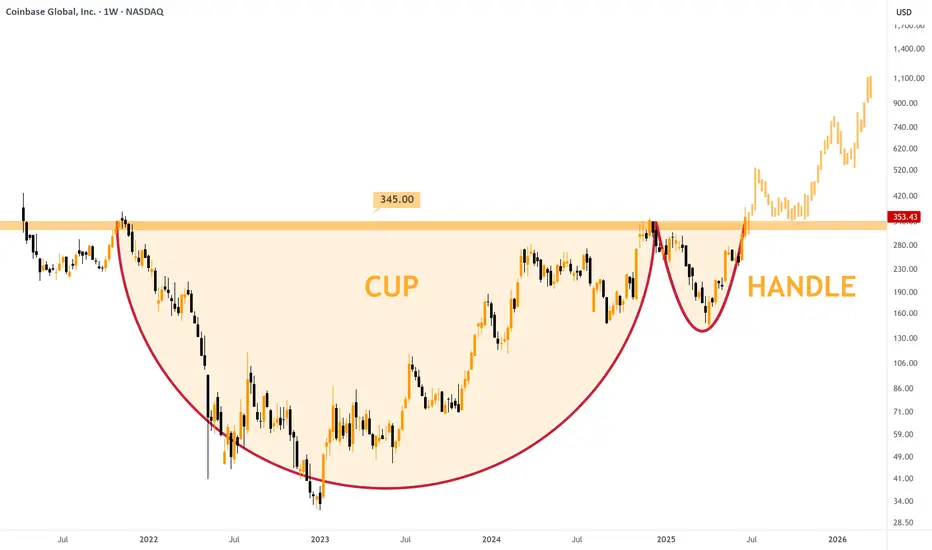
$COIN — Most Bullish Stock NowThe title of the idea is not lying, NASDAQ:COIN offers one of the most bullish charts I've seen on the stock market in a while - there is a HUGE Cup & Handle pattern.
On the 1W charts we can see a multi-year rounding bottom that began in late 2021, followed by a clean handle consolidation and a breakout above the $345 neckline. The breakout of the $345 neckline implies long-term targets between $650 and $1,000 if momentum persists.
Fundamentals of the company suggest a sharp growth as well:
NASDAQ:COIN joined the S&P500 Index which attracted money from thousands of investors
Launch of Coinbase Payments, tapping stablecoin growth (USDC revenue up ~31% QoQ to ~$296M), perfectly fit for the narrative about stables in USA
Coinbase's most recent earnings show strong growth: in Q1 2025, the company generated about $2.0 billion in total revenue, reflecting a substantial 24% year-over-year increase
To sum up, I can find zero reasons why you shouldn't have this stock in your mid-long-term portfolio.
COIN Pullback or will lose steam ? Watch the levels for bouncesLet's dive into a technical analysis of Coinbase (COIN) stock with your requested indicators and patterns on a daily chart, as of Friday, June 27, 2025, at 9:27:54 PM PDT.
**Current Price & Performance:**
* **Last Price:** $353.297 (as of 4:00 PM ET on June 27, 2025)
* **Today's Change:** Down $15.779999 (-4.27399%)
* **Previous Close:** $369.21
* **Today's Range:** $346.66 - $372.50
* **52-Week Range:** $142.58 - $382.00
COIN has seen a significant run-up recently, up 44% in June, and was added to the S&P 500 in May, which has likely contributed to buying pressure from index funds. Today's session saw a notable pullback.
---
### **Bull Flag Analysis: Played Out & Potentially Forming**
A "bull flag" is a bullish continuation pattern that forms during an uptrend. It consists of:
1. **Flagpole:** A strong, sharp price increase (the "pole").
2. **Flag:** A period of consolidation, often a rectangular or parallelogram shape, with a slight downward or sideways slope, characterized by decreasing volume.
**The Bull Flag that Played Out:**
COIN has been in a strong uptrend in recent weeks and months, particularly in June. This sustained upward movement would have created multiple "flagpoles." As the stock consolidates after these sharp moves before continuing higher, those consolidation phases would represent the "flags."
Given COIN's significant increase of 44% in June and reaching near its 52-week high, it's highly probable that **a series of bull flags have played out** during its ascent. Each time COIN had a strong upward leg, followed by a brief period of sideways or slightly downward consolidation (the flag), it then broke out to the upside, continuing the overall bullish trend. This pattern aligns with its recent performance.
**Another One Potentially Forming:**
Today's 4.27% drop, coming after COIN hit multi-month highs, could be the *start* of a new "flag" formation.
* **New Flagpole:** The sharp run-up through June to the recent high of $382 can be considered the latest "flagpole."
* **Potential Flag:** The current pullback to $353.297 (and intraday low of $346.66) could be the initial phase of consolidation that forms the "flag." For this to be a classic bull flag, we would expect:
* **Consolidation:** The price to trade within a relatively tight, slightly downward-sloping or sideways channel for a few days or weeks.
* **Decreasing Volume:** Volume to typically decrease during this consolidation phase.
* **Breakout:** A subsequent breakout above the upper trendline of this consolidating channel, ideally on increasing volume, to signal the continuation of the previous uptrend.
**Right now, the pattern is very nascent.** It's too early to confirm a new bull flag, but the recent strong rise followed by a pullback fits the initial characteristics. Traders would be watching for the consolidation and then a clear breakout.
---
### **Williams Alligator Strength (Daily Chart)**
The Williams Alligator indicator uses three smoothed moving averages:
* **Lips (Green Line):** 5-period SMMA, shifted 3 bars forward.
* **Teeth (Red Line):** 8-period SMMA, shifted 5 bars forward.
* **Jaw (Blue Line):** 13-period SMMA, shifted 8 bars forward.
**Interpretation:**
* **Strong Trend ("Eating"):** When the lines are fanning out and ordered (Green > Red > Blue for an uptrend, or Blue > Red > Green for a downtrend), the Alligator is "eating" and the trend is strong.
* **Consolidation ("Sleeping"):** When the lines are intertwined or very close together, the Alligator is "sleeping," indicating a non-trending market.
**COIN's Alligator State:**
Given COIN's powerful rally through June, the Williams Alligator was undoubtedly in an **"eating" phase, with its mouth wide open upwards (Green line above Red, Red above Blue)**. This signifies strong bullish momentum.
Today's significant pullback (-4.27%) likely caused the **Lips (green line) to cross below the Teeth (red line)** or at least move very close to it. This indicates the Alligator is beginning to "sate" itself or move towards a "sleeping" phase.
* **Strength:** While the *overall* trend, as indicated by the wider separation of the Teeth and Jaw, might still be considered bullish on a slightly longer timeframe, the *immediate strength* as signaled by the Lips is weakening. The Alligator is likely no longer as aggressively "eating" upwards as it was.
* **Weakening Momentum:** The crossover of the Lips below the Teeth is a short-term bearish signal, suggesting a loss of immediate upward thrust. If the Red line also crosses below the Blue, it would confirm a more significant shift to a neutral or bearish trend.
---
### **Confluence of Two Fibonacci Retracements from Different Top/Bottoms**
Fibonacci retracement levels are typically drawn between a significant price high and a significant price low (or vice versa) to identify potential support and resistance levels. For confluence, we look for areas where different Fibonacci levels from *different* swings align, creating stronger price zones.
Let's consider two potential significant swings for COIN based on its recent price action and 52-week range:
**1. Recent Major Swing:** From 52-Week Low to Recent High
* **Low:** Approximately $142.58 (52-week low)
* **High:** Approximately $382.00 (recent high)
Applying Fibonacci retracement to this major upward swing:
* **23.6% Retracement:** $(382.00 - 142.58) * 0.236 + 142.58 = \$199.14$
* **38.2% Retracement:** $(382.00 - 142.58) * 0.382 + 142.58 = \$233.15$
* **50.0% Retracement:** $(382.00 - 142.58) * 0.500 + 142.58 = \$259.98$
* **61.8% Retracement:** $(382.00 - 142.58) * 0.618 + 142.58 = \$286.82$
**2. More Recent, Shorter-Term Swing:** From a recent consolidation low to the recent high
Let's consider a recent short-term low before the final push to the recent high. One source points to a swing low of **$294.56$ (June 23) to a high of $382$ (June 26).**
Applying Fibonacci retracement to this shorter-term swing:
* **23.6% Retracement:** $(382.00 - 294.56) * 0.236 + 294.56 = \$315.21$
* **38.2% Retracement:** $(382.00 - 294.56) * 0.382 + 294.56 = \mathbf{\$327.97}$
* **50.0% Retracement:** $(382.00 - 294.56) * 0.500 + 294.56 = \mathbf{\$338.28}$
* **61.8% Retracement:** $(382.00 - 294.56) * 0.618 + 294.56 = \mathbf{\$348.60}$
**Confluence:**
The current price of COIN is $353.297.
Looking at the second, shorter-term Fibonacci retracement, the **61.8% level at $348.60$ is very close to today's intraday low of $346.66$.** This indicates that this specific Fibonacci level acted as a significant support level today.
While there isn't a direct "confluence" where a 38.2% from one swing aligns perfectly with a 50% from another right at the current price, the fact that the **61.8% retracement from the most recent significant upward impulse ($294.56 to $382.00) provided strong support today** is a key observation.
**Significance:**
* **Recent Support:** The price tested and rebounded from the 61.8% retracement level of its most recent significant rally, which is often considered a strong reversal point for a healthy pullback within an uptrend.
* **Confirmation for Potential Flag:** If this level holds, it reinforces the idea that the current pullback is a "flag" in formation rather than a full trend reversal.
---
### **Overall Summary for COIN:**
* **Bull Flag:** COIN has experienced and completed several bull flags during its ascent. The current pullback from the $382 high could be the formation of **another bull flag**. For confirmation, watch for consolidation within a defined range and a subsequent breakout.
* **Williams Alligator:** The Alligator, which was "eating" aggressively during the recent rally, is now likely showing signs of **sating or sleeping** as the Lips (green line) cross below the Teeth (red line) due to today's pullback. This indicates a weakening of immediate bullish momentum and a potential period of consolidation or correction.
* **Fibonacci Confluence:** The price found strong support at the **61.8% Fibonacci retracement level ($348.60) of its most recent significant swing ($294.56 to $382.00).** This is a critical level for bulls to defend if the overall uptrend is to continue.
**Outlook:**
COIN is currently undergoing a healthy pullback after a strong run. The bullish underlying trend remains, supported by its S&P 500 inclusion and analyst optimism. However, the technical indicators suggest a period of consolidation or further retracement is likely. The $348.60 Fibonacci level will be crucial. If it holds, it increases the likelihood of the current pattern being a bull flag for another leg up. A break below it could lead to deeper retracements.
As always, remember that technical analysis provides probabilities, not certainties. Combining this with fundamental analysis and managing risk is crucial for any investment decision.
COIN - Looks Cooked, Let's Go ShortCOIN
Is suddenly slumping from a major point of high liquidity:
- It is above ATH resistance
- It is hitting a long term ascending trendline take from the first two significant peaks of the bull trend.
- It has pivoted within a reverse 2.272 Golden Window (up to 2.414) taking the 2 pivots at the base of the minor degree uptrend.
Coinbase has been on a significant rally in this area ahead of other Bitcoin Treasuries that have been corrective.
But if it gains momentum, then we may see some significant downside.
I entered a short and have may let it run a little if it made a new high;- this is a low margin entry 👍.
This analysis is shared for educational purposes only and does not constitute financial advice. Please conduct your own research before making any trading decisions.

COIN potential +40% move up this year Potential inverted Head&Sholders forming with target to 300$ zone. But, before moving up it shall retrace a little bit.
Not financial advice, only for learning purpose published.

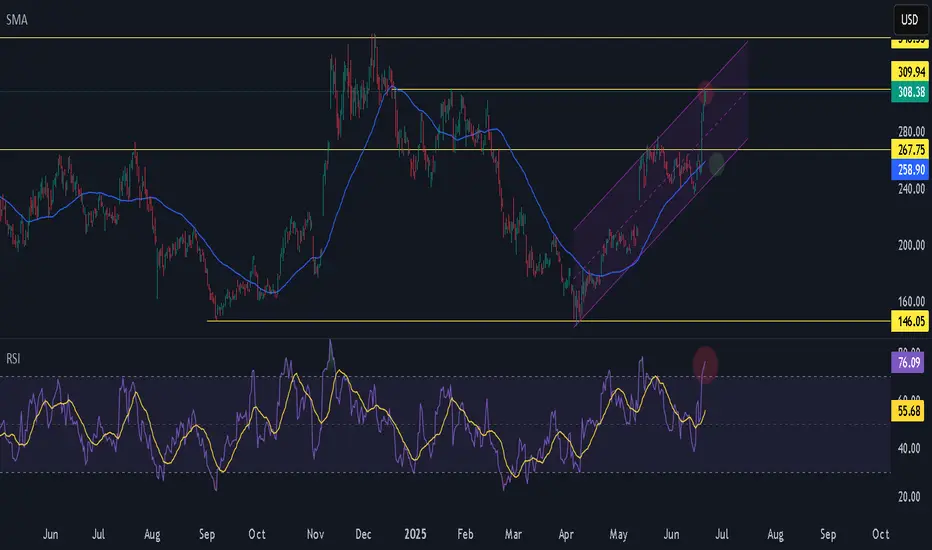
COIN Stock: Key Resistance Levels and Growth Catalysts AheadCoinbase (COIN) stock has been on a strong uptrend recently.
Technically , the stock is trading above the 50- and 200-day averages. The RSI level has reached 77, indicating that it has entered the overbought zone. In the short term, the $310 level stands out as a critical resistance. If this level is broken upwards, targets can be set at $348 and above. In possible corrections, $265 can be monitored as a strong support.
The “GENIUS Act” stablecoin regulation passed by the US Senate was a major catalyst for Coinbase, and the stock rose 16% after this news. In addition, the company obtained a crypto license from the European Union and expanded its services across the EU. It also made a strong entry into the derivatives market with the acquisition of Deribit. All these developments enable the company to grow its product diversity and global footprint.
Overall, COIN stock is technically strong and in a bullish phase, supported by fundamental data. '' Although there is a possibility of a short-term correction due to the high RSI '', the company's medium- to long-term growth story sends positive signals to investors. While the $250-$265 range can be monitored for buying, a strong rally may start if the $310 resistance is broken.

COINBASE 15-min Day Trade | Targeting 4.8% Upside IntradaySmart Money play in motion.
🔹 Entry Zone: ~$349.90 (ORB bounce + Fib retrace confluence)
🔹 Target: $366.43 (liquidity above weak high + 0.886 Fib zone)
🔹 Risk: Below $346.22 (prior BOS level)
📊 Setup Logic:
Volume spike post-ORB confirms demand.
Price retraced into golden pocket (0.618–0.786) with rejection wicks.
Fib symmetry aligns with intraday premium zone.
Clean 4.8% potential move with smart money footprint confirmation.
✅ Scalpers and day traders should monitor PA closely around 356–359 for possible rejection or continuation. Adjust stops as trade develops.
⚠️ Educational purpose only. Trade your plan, not hype.
#COIN #DayTrading #SmartMoneyConcepts #ORB #Fibonacci #VolumeProfile #PriceAction #CryptoStocks #WaverVanir #IntradaySetup #TradingView

TOTAL 3 > Coinbase Leading IndicatorCoinbase (COIN) continues to outperform, with its chart pushing into new territory — just as TOTAL3, the index tracking the market cap of all crypto excluding BTC and ETH, edges closer to a breakout.

Short COINBASE $COINPlease do your own analysis, i am not responsible for your losses. Trading is risky.
This is daily candle, so when will it happen will take time, 1month or 1.5 month...can't know that.
Please don't tell me you traded and lost, you have to be careful.
The price will drop to the target green area..

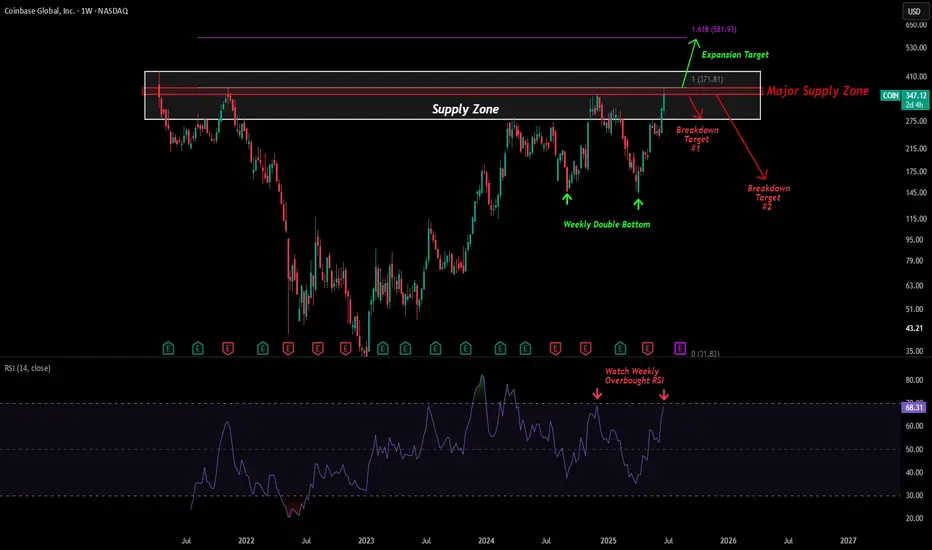
COIN - Entering Major Supply ZoneBig move from Coinbase — now pushing into a major weekly supply zone between $350–$370.
This zone has capped every rally since Q1 2022. Price tapped it during the 2024 crypto run and got rejected hard. Now we’re back — and weekly RSI is once again testing overbought territory.
This sets up two key scenarios:
*Scenario 1 – Breakout
A clean breakout above $370 would be significant. That level aligns with prior rejections and sits just below IPO highs near $430.
If $430 is cleared, the next target is the 1.618 fib extension near $580–600
This would likely coincide with Bitcoin pushing to new ATHs
*Scenario 2 – Rejection
If sellers defend this supply zone again:
Look for a pullback toward the $280 zone (bottom of the white box)
Lose that → next downside target is $160, just above the weekly double bottom that kick started the recent rally
*RSI is the wild card
Weekly RSI is knocking on the same level that preceded a 60% drop in late 2024. Last time we broke above it (early 2024), COIN rallied 90%.
Break or reject — the RSI will likely front-run the next move.
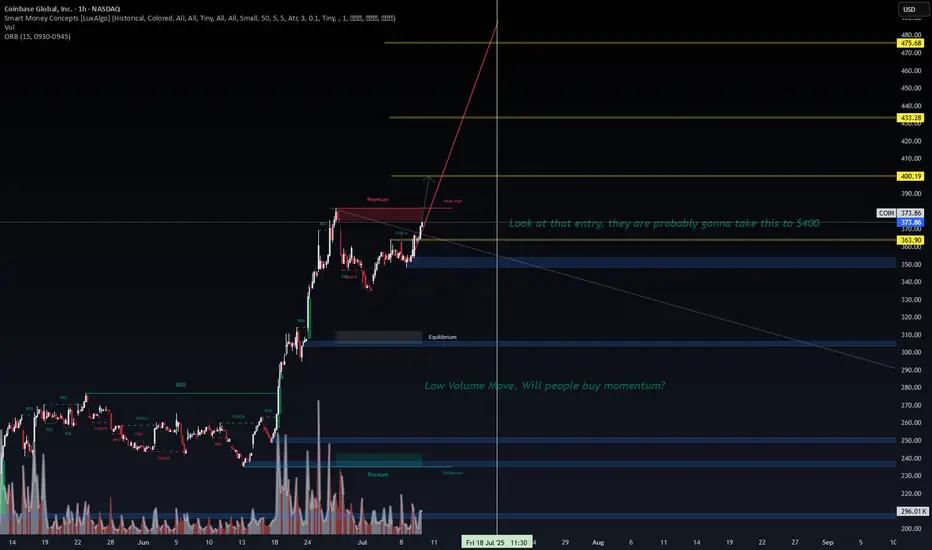
COINBASE (COIN) – Smart Money Accumulation Confirmed | Eyes on $The structure has shifted decisively.
🔹 Smart Money Concepts in Action
Price has reclaimed equilibrium, flipped BOS zones, and left behind a weak high in premium territory. Current PA suggests institutional accumulation with a clear intent to drive price towards inefficiency above $400, targeting the historical supply near $470.76.
🔹 Key Zones
Equilibrium: ~$240
Discount Zone (Demand): $154.13 - $200
Premium Zone (Supply): >$348
Volume Surge confirms conviction behind the breakout.
📌 Expect a reaction near $380–400, but if momentum holds, the liquidity vacuum toward $470 may get filled faster than most expect. Watch for continuation signals and manage risk accordingly.
💡 This is not financial advice – just tracking footprints of capital.
#COIN #Coinbase #SmartMoneyConcepts #SMP #VolumeProfile #VWAP #LiquidityGrab #TradingView #SMC #Equilibrium #BreakOfStructure #CryptoStocks #WaverVanir
