21P trade ideas
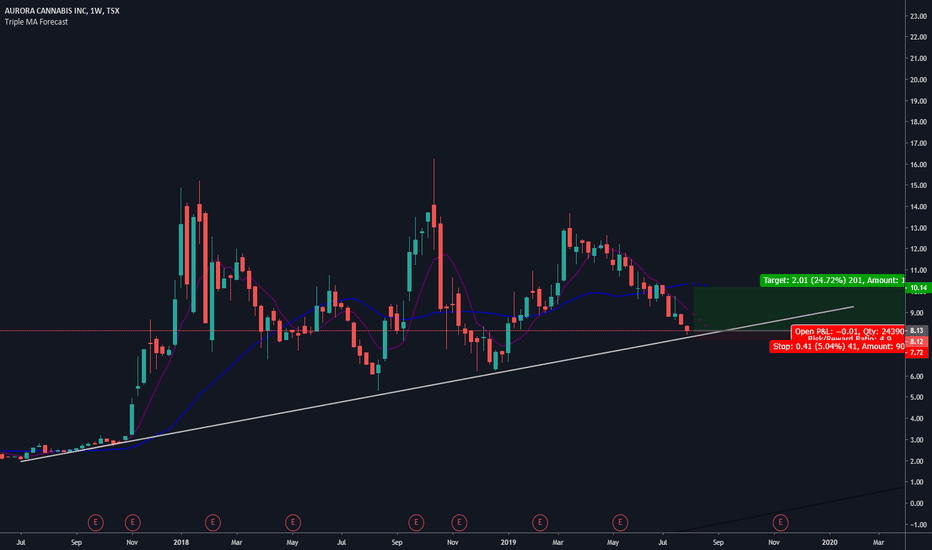
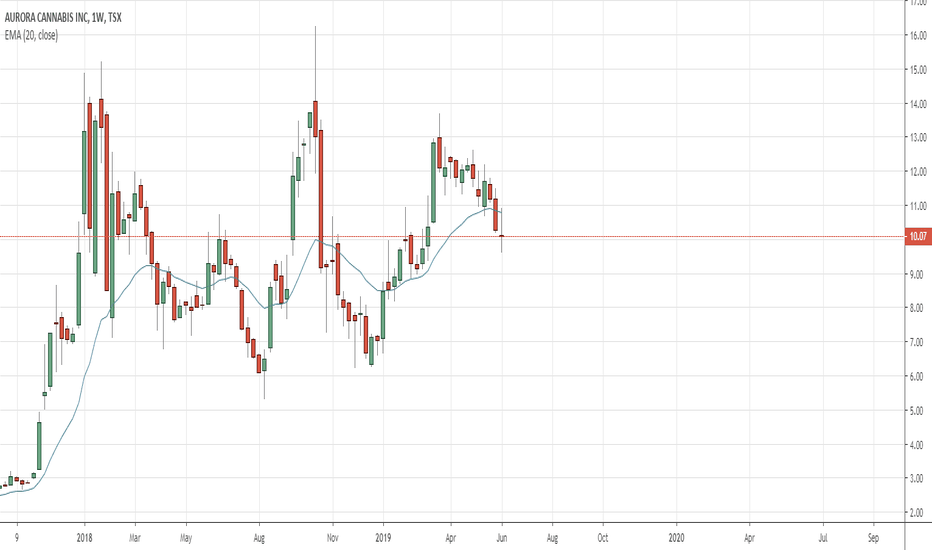
ACB Trendline Bounce TradeACB appears to be in a good buy spot here- This stock along with many of the marijuana names have been beaten up in the last few weeks/months.
The price is on/near the diagonal bullish trendline it has respected for a long period. Although it is not the strongest of trendlines with only 3 real bounces. I do think the risk meets tbe reward here.
Im looking at a trade just under 5:1.
Close any weekly candle close below the trendline. Take profit at the moving average. If it breaks the moving average in a strong way I will update my price targets.
Happy Trading :)
ACB 50/50 Bull Flag Trading Range - Breakout ModeACB is currently in the dead center of the bull flag trading range, and a converging triangle. This is where the directional probability is very close to 50/50. However the bulls have a slight advantage because it is a bull flag trading range, and there are bull gaps below. Prices are currently stalling at the failed bear reversal, where trapped bears may soon buy and contribute to a rally. However there is no valid but setup yet this week. The Bears want a test of the 7 low, and to fill the bull breakout gap. If this gap is filled, it will decrease the bull strength and prices will likely remain range bound for the next 20-40 bars. If instead the bulls keep the breakout gap open and form a higher low in the coming weeks, it will increase the probability of a test of the all time high and possibly bull trend continuation. But since prices are in a trading range, there will probably be some profit taking and short selling at a new all time high, unless the bull rally and breakout is exceptional.
If you found this helpful, please like and share. Feel free to comment or ask questions.
What is "Price Action"? What about indicators?There is no one clear definition of price action. It can be as simple as "Every tick on any given chart, of any given market." However this definition is too broad and does not adequately describe the term. A better definition is "The collective result of buyers and sellers entering the market for any logical reason, which together create reoccurring patterns that can be analyzed and capitalized."
Price action is based on humans behaving rationally, logically, and similarly in similar situations over time, and is the cumulative effect of institutional trading. It has been, and always will remain fundamentally unchanged. If you compare a chart from 100 years ago (such as the crash of 1929) with one of today with the time scales removed, you will not be able to tell the difference between the two. It does not matter if you compare a yearly, monthly, daily, or even 1 minute chart with any other chart of a different time frame. Price action appears the same and works the same in every market, and on every time frame. The institutions cannot hide what they are doing; price action is their foot print.
Price action can be used to invest long term, or day trade any market. It allows a trader or investor to identify opportunities without the use of any indicators. In fact, all indicators are a derivative of price action in one form or another. Interestingly, the patterns which repeat as well as trend tendencies can be observed on different charts, even outside of markets.
Can you tell a difference between these two charts? The first is a daily chart of CSX. The second is a 5 minute chart of the MES (micro s&p). All markets and charts look the same, and behave similarly. Once you understand the information within, you can understand what the institutions are doing at any given time.
$ACB Weekly AnalysisThe past few weeks have been sideways to down from a lower high, but weak selling pressure. The bears want the lower high to hold and to test the double bottom around $5. Prices are currently in a converging triangle and bull flag trading range as both sides fight for control. If this week closes on its high, it would be a wedge bull flag, double bottom pullback, and also a double bottom with the previous failed bear reversal. If the bulls are able to form a wedge flag soon and keep the 5.25 bull gap open, they will increase the probability of a test of the all time high. Although there will probably be some profit taking at the new high since a trading range. The bears need strong consecutive bear bars and a breakout below the double bottom before the market is clearly no longer controlled by the bulls.
If you found this helpful, please like! Feel free to comment or ask questions.
ACB - Cup and Handle.ACB - Interesting set up here. A while back I had charted ACB as bearish with a gap below a triangle pattern quite some time ago. I usually dont allow wicks to hold a lot of weight when looking at charts but one user did reply that the chart had filled that gap with wicks which it indeed did. After a re evaluation look here some time later i feel that this cup and handle pattern that has formed is much more a telling story than the last observation and those "wicks" should act as the gap filler as I am quite bullish on this in particular set up with the sector being the way it is. As always, it can go either way but I am bullish here but sure would like the MACD to cross up!!! Will be watching closely!
$ACB Aurora Cannabis Failed the bullish ascending triangle, now looking to catch support at $12.04 and hopefully bounce to break through resistance at $12.35 and head on its way to new highs, once again.
If the support fails, look to fall to $11.26 and if that fails, it’s a free fall to under $10.
RSI neutral
ACB Short Opportunity ACB is starting to waiver as it approaches support and it's next test will be the final one for the trend. If it breaks here we're moving into a bearish move. However it could also hold and move higher the market does seem to be fading. The odds of a bearish move are picking up. I'm going to engage in a PUT position against ACB.
Buying 4x PUT EXP May 17 Strike 11 Cost is 0.85 per contract.
Target is going to be at $9.5 - $9


