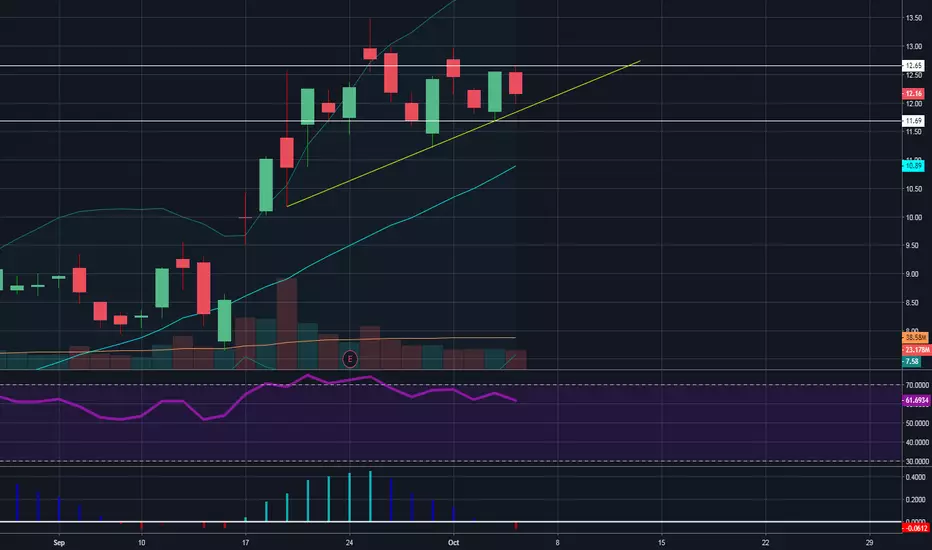
Significant bullbreak puts focus on potential ACB daily breakoutACB broke the 4hr equilibrium bullish today right before market close then the uplisting NYSE application they filed with the SEC surfaced online. The daily volume is only moderately larger, but the amount of volume coming in the last hour of trading was incredible
The key resistance now for the daily breakout is 12.95, really 13.00 psychological. Key support to hold is 11.69 on the daily. Daily RSI is also piercing through the resistance line and the bulls want to see continuation early next week to accompany this 4hr breakout.
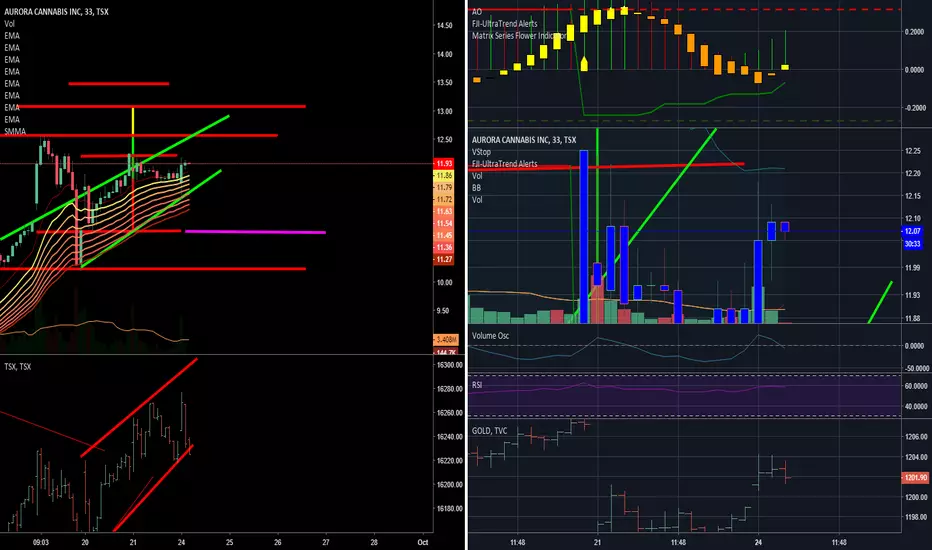
Looking at the 4hr, you can see the clear bullbreak of 12.65 resistance on the 4hr chart. There's a lack of support down to 11.95 and the chart is over-extended.
Looking at the 5min chart you can see there hasn't been any short term supports set since 12.05. We are very over extended here and there are no good entries without some healthy consolidation to cool off the charts and give the bulls a rest. You can see the incredible amount of volume pouring in when the SEC uplisting documents surfaced online - so even though the daily chart didn't have impressive volume, you can see how much bullish momentum came in at the end of the day. There were definitely shorts being squeezed on this move, and the next level we will see shorts cover is on the break of $13.00 in my opinion. The Canadian exchanged is closed Monday for Thanksgiving so it will be up to the American ticker ACBFF bulls to determine the fate on Monday.
Be aware there is market correlation between the mj sector with the S&P500, and keep in mind that it lost the weekly uptrend today. It's often said that high tides raise all boats; likewise, low tides can beach all ships.
By the way, I do analysis on the entire sector across all the mj charts I publish. If you're not looking at all the names I talk about, you're not getting the full sector-wide analysis. Follow me to get updates when I publish ideas and pay attention to the mj names you typically don't look at too, so you can stay in the know and get the full picture.
21P trade ideas


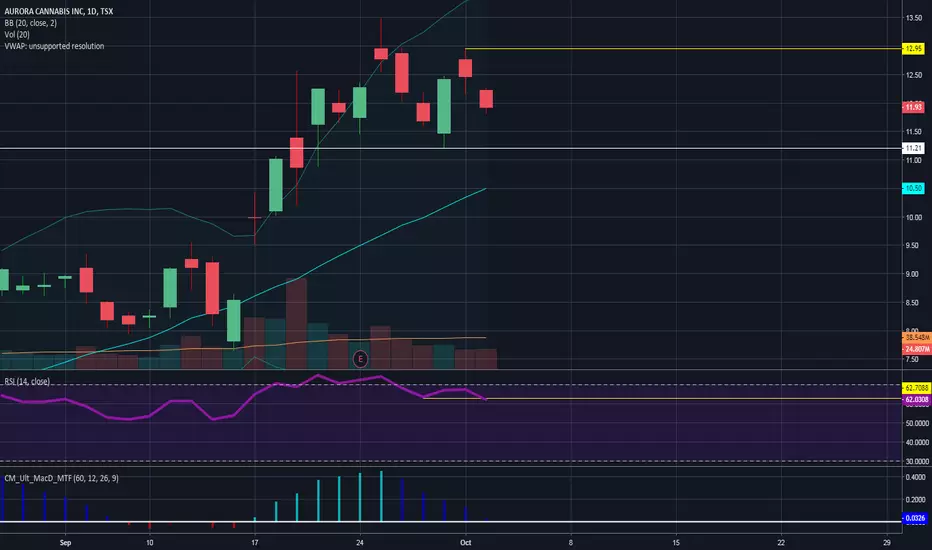
ACB equilibrium break on watch tomorrowACB saw a gap up and profit taking, forming a daily lower high right within the range I was anticipating. The daily chart is going to break Friday, and if not Friday, then Monday by way of the American ticker ACBFF, making the break Tuesday when the Canadian market reopens after Thanksgiving. The daily printed a bearish dark cloud cover candle.
The key daily range is 12.65 - 11.69. Beak bull, and bulls continue to test $13 and $13.50 resistances. Break bear, and we look down to test supports at 11.21 and 10.87
Zooming into the 4hr shows us that our daily equilibrium is now so tight, it's playing out on the 4hr chart. I find this gives the best clarity on what's going on. Bulls are trying to hold 11.98 as the new support but have not yet bounced enough to give us confidence that higher low is in.
Be aware there is market correlation between the mj sector with the S&P500, and keep in mind that SPY lost the daily uptrend today. It's often said that high tides raise all boats; likewise, low tides can beach all ships.
By the way, I do analysis on the entire sector across all the mj charts I publish. If you're not looking at all the names I talk about, you're not getting the full sector-wide analysis. Follow me to get updates when I publish ideas and pay attention to the mj names you typically don't look at too, so you can stay in the know and get the full picture.
Another boring day in Crypto... AURORA!!Hello traders,
There goes another mundane day in crypto, so I decided to look into more weed stocks and Aurora looks pretty juicy.
Looking at 4 hour chart, Aurora just touched the descending blue trendline. In case of breakout, I will place buying order around $13 and get out around $15 which gives me decent 15% profit :)
I would give 75% chance of bull breakout as it needs to finish Elliot 5th Wave in order to complete the cycle. (Wave 3 is bigger than Wave 1, therefore we should have another wave)
Happy trading!

ACB daily equilibrium break on watchI just typed up a big analysis and deleted it, so here we go, round two!
Bulls today were in full control printing a bullish engulfing candle on the daily. Anything under 12.95 is a lower high on the daily, and I anticipate that to be set around $12.75. I would be very impressed if the bulls were able to break $13.00 psychological first thing tomorrow.
The setup here is different than it is on Canopy; Canopy didn't set any hourly support today, but Aurora has a new hourly support to watch at 12.26. The most bullish scenario would be to hold that level then go for a bull-break of 12.95. Losing that support will have us looking down at 12, and 11.69.
If we do lose 12.26 that level I'll be watching the bear volume on the pullback to anticipate the extent of the pullback we will see. If we do ultimately break 11.69 in the coming days, that would put Aurora into a daily downtrend, but I see no warning signs of this happening at this time.
The range to watch is is 11.69 - 12.95.
By the way, I do analysis on the entire sector across all the mj charts I publish. If you're not looking at all the names I talk about, you're not getting the full sector-wide analysis. Follow me to get updates when I publish ideas and pay attention to the mj names you typically don't look at too, so you can stay in the know and get the full picture.

Aurora - Technical AnalysisDear Traders,
Looks like we enterred a second ''bearish'' tunnel, but if we succeed in breaking out of it like we did the first time we might see another run soon. But if we break downwards we will officially retracing towards the 0.5 fib level again, which held twice already so that looks like a good entry point for those who want to re-enter this trade, but this will only happen if we break downwards of this channel.
About Aurora:
Aurora Cannabis Inc is a Canada-based company engaged in the production and distribution of medical cannabis. The Company is vertically integrated and horizontally diversified across every key segment of the value chain, from facility engineering and design to cannabis breeding and genetics research, cannabis and hemp production, derivatives, home cultivation, wholesale and retail distribution. The Company's purpose-built facilities, which integrate technologies across all processes, are defined by automation and customization. The Company has a funded capacity of more than 500,000 kilograms per year, as well as sales and operations in more than 18 countries worldwide.

ACB far from support break but showing tell-tale signsACB held up very well today in the face of across the board sector weakness. 11.21 support is key to save the daily uptrend; I do expect that level to hold and I would then look for a tightening daily range and a lower high relative to 12.95.
Volume offers no real red flags but RSI has broken support and shows the first signs of bearish divergence.
ACB offers a potential bottomfish opportunity tomorrow, but be sure to stop out if 11.21 support breaks as that would confirm a daily downtrend and I'd be looking down towards the mid $10 range for a new temporary base.
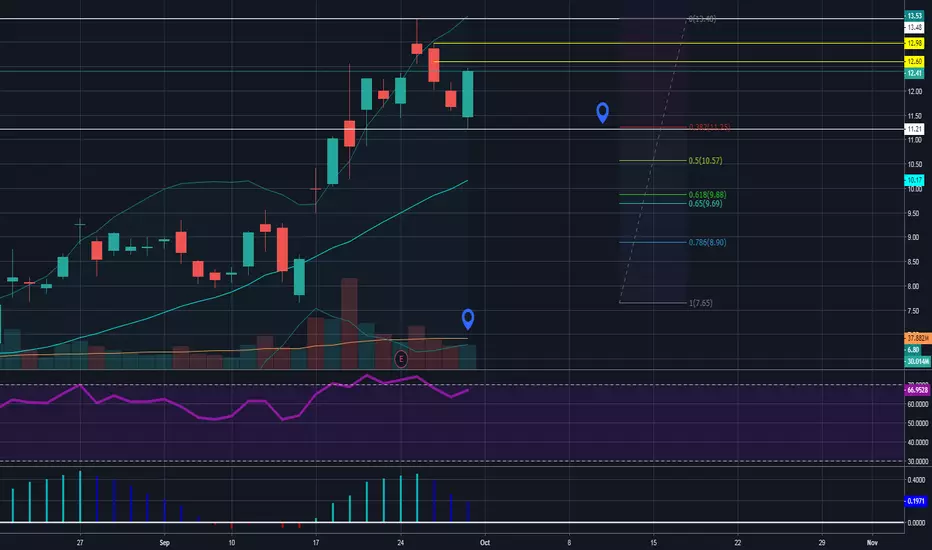
Sector weakness holding back ACB bullsI'm still impressed by the ACB bulls with their bounce hitting the very top end of my target zone, rejecting from the .786 fib pull just below $13.00 resistance. Having lost the hourly higher low pattern this afternoon I'm confident that our new daily lower high has been set. I'm looking for an equilibrium to form, and anticipating a higher low relative to 11.21 and a daily tightening range as volume drops off. On the break of that range I'll be watching for a volume spike to confirm the momentum.
I love equilibrium patterns because they are one of the best patterns to play in my opinion, but one must keep in mind we're watching this range tighten as CGC / WEED is most likely going to have a daily bear break, putting downward pressure on the sector, including on ACB. Coca-Cola rumours are helping the bulls stay strong, but without an actual deal a rumour can only do so much in the face of a sector that's pulling back pretty significantly.
The range for me right now is 11.21 - 12.95. As long as CGC does not break below $48 (or WEED break below $62) I would definitely be interesting in bottomfishing a daily higher low on ACB above 11.21. If CGC breaks bear, I fully expect ACB to follow suit and lose our key 11.21 daily support level.

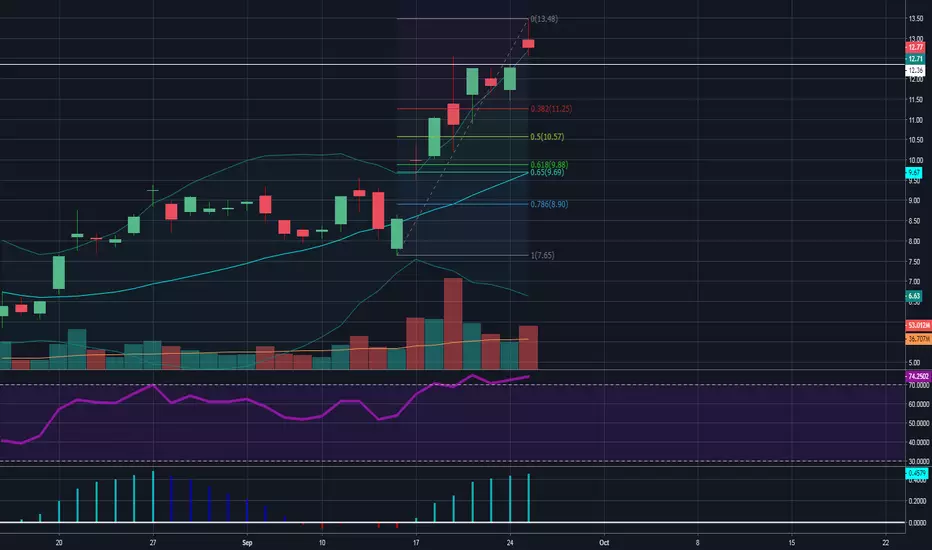
ACB is strong in the face of sector weaknessACB broke key daily support but bulls bought the dip and finished strong near the high of the day, completely ignoring the end of day dump by the sector leader on bearish news. Price bounced just below the .382 fib level from low of consolidation to our recent high.
The daily volume was far less than I would have liked on this move, and so I expect a daily lower high to best set Monday most likely. Hourly resistance is 12.60 then 12.98 (call it 13 psychological), and I'm looking for the daily chart to top out somewhere within that range. That said, breaking $13.00 would have me very impressed but we will need much more volume to get there.
The new daily range I'm watching is 11.21 - 13.48 (again, let's call it $13.50 psychological). ACB is holding up much better than many names in the sector on the back of Coca-Cola investment rumours and an uplisting to a major US exchange this month.
In two weeks ACB saw a 70% move from 7.65 - 13.53 and the weekly chart is very extended, and is more likely than not to require a pullback before any continuation to the upside is possible. That said, a news catalyst can definitely change that and push the chart to new highs.
AuroraLarge bullish wedge (outlined black) currently in a breakout. If the breakout is sustained and the .618 fibo line ($10 zone) is broken, while using the pitchfork strategy, you can see aurora can potentially reach 20 Dollars by May 2019. Continuing good news can accelerate this growth.
Pitchforks can be broken in both directions - it is only a guideline or enlarged operating channel.
The purple trend lines will act as weaker resistances or supports along with the moving averages (9,27,99).
Potential outcomes to plan for:
- The 618 line could give some good resistance - look for a rejection and retest of the 618 of a max of 50 cents. With a tight stop loss - mitigate the loss of the bounce and monitor other indicators closely with a limit entry to maximize profits.
- We punch through the 618 and are pulled back down - utilizing the same strategy as above.
- Good news propels investors through the 618 and to the 768 at 12 dollars - look for a bounce off this zone as well and utilize the same strategy once again.
In case of a false break tied with negative indicators/news - look for the 6.70-6.80 range for a re-entry.
Where do you want to enter? Do your expectations meet possibility? Where do you want to exit? Plan before you panic.
Whether a Swing or hold this stock will make you easy money. Do not get greedy!

Aurora Cannabis AnalysisACB's Significant weekly demand @ 8.93.
Longs are favoured but not at current price level. Look for pullbacks into weekly demand.
Zones of Interest:
Demand @ 8.61 and 6.49
Supply @ 14.07.

ACB bulls have their backs against the wallACB opened right at $12.00 price support from yesterday and broke it on open, and wasn't able to recover it later in the day. This is not game over for the bulls, as chart support remains at $11.44 but it's certainly a stronger pullback than the bulls had hoped for just 3 days after reaching new highs in reaction to earnings. IF there's any consolation for the bulls it's that this pullback is on decreasing volume.
I am watching the potential for a bearish-reversal Head&Shoulders pattern printing on the daily chart, and will be watching the volume on the hourly chart on the next move for clues if we will continue our daily uptrend or fall back down to test our key support levels.
Resistance for the bulls to start to turn things around is 12.17, followed by 12.60. KEY MUST HOLD support is 11.44. Losing $11.44 puts us in a range with a minimal amount of volume support - I see a lot of support just above $10.00, at $9.06, and the gap on the daily chart $8.64

ACB finds it's supportMy last published piece on ACB indicated the bulls were looking for a new base of support, and today it's become clear that line in the sand is $12.00. The day started with a higher open and a strong attempt to break $13, and profit taking starting a minute into the day. Bulls immediately fill the gap to the penny and tried to rally from there, but were unable to do so and bounced off of $12.01.
At numerous times today you could see $20 million on the bid between $12.00 - $12.15, telling me white the chart support is down at $11.44, this is where people find VALUE and that's an important support level too. With weakness today across the sector and weakness in the overall market with reaction to the FOMC minutes and the declaration that "stocks are too expensive", it's going to be very telling how the price reacts to $12.00 tomorrow. That's the line in the sand.
Hourly resistance to give us confidence the daily higher low is in is at $12.60, that small range will be on watch tomorrow. That break will give us directional momentum for the next couple of days.

HUGE breakthroughSolid consolidation after ABC correction followed by a spectacular breakout following the coca cola hype.
Wouldnt be surprised to see this over 20$ in 1 month from now purely on momentum following fomo which is typical of any bubble


ACB searching for a new base of supportACB had a big gap up on earnings this morning and saw a continued run into their conference call, however when the call failed to deliver a news catalyst investors started to take profit, breaking the low of the day and dropping to test former key resistance $12.56 as support. This bearish candle suggests further downside tomorrow, and I'll be watching two key areas for support. First, the low of today 12.54, and second the gap fill 12.36. We also have hourly support just above 12.00.
What would a healthy pullback look like? Holding above $12 psychological would show the bulls maintaining complete control, but really the must hold level is 11.44, the loss of which would indicate we're in for some heavier consolidation rather than an immediate continuation of this bull move. If that were to happen I'd start watching for trend changes on smaller term timeframes as we approached key Fib levels as indicated belowl.
The decreasing bear volume on the hourly chart has me expecting we will hold above $12.00 at least on the first attempt; however weakness in the sector and the overall market will be a correlative factor to watch.
ACB idea from weeks ago MET!Hey guys,
I am just following up with chart for my ACB analysis. We have been very bullish. With the q4 financial report out, it was mentioned that ACB had a high revenue return. With that said, we look again at the same chart that I posted weeks ago. My analysis remains the same. The last 3 daily candles are confirming candles that is above the 12.25 CAD target(resistance level). This week to the next, we are going to hit 14-15CAD which will act as the new resistance. I suspect a bounce down from that resistance before we pierce through it to a new all-time high level which I am very confident that we will.


Bullish Momentum Likely to continueIt appears I may have been wrong on a pull back. Momentum appears to suggest continuation of bull run. no price targets as of yet.

ACB bulls draw a line in the sandACB spent the better half of Friday defending $11.75 as a line in the sand, despite the hourly bearish MACD divergence. If that cannot hold I would not expect 11.65 to hold, resulting in an Inside Bar bear break. From there I would zoom out to the 4hr chart and look for a higher low compared to $10.18 and a tightening range from there.
Investment rumours from Coca Cola give correlation favour to the bulls, and I would expect ACB to hold up better than other names should we see sector-wide consolidation this coming week.

AURORA CANNABIS INC. (ACB) - Daily AnalysisJust starting to take a look at these marijuana stocks a bit more seriously.. my previous analysis on TSX:WEED (see below) seems to be panning out so I'm pursuing this market a bit further.. don't usually trade company stocks so this might be my way into that world.. still seeing the same kinds of natural patterns I'd encounter on Forex or Comex charts, so giving it a try.. for this particular company, I have already bought up a few shares around $12, which might have been premature now that I'm expecting a small correction to around just under $11 (which will be a better time to buy).. but I'll be holding this for a while, especially if it passes my first target around $15 and possibly add more positions then.. will continue to monitor..

ACB Tightening Ranges. Thank you for your continued interest. The outlook for tomorrow, continues to be bullish. Green = expected sp of 12.56 - 11.82. Could be as high at 13.06 ps in yellow. I do not expect a pull back tomorrow, however if an announcement is made that does not favor the industry the share price will likely retest 10.92 support. In accordance with the bullish recovery from the TSX as well as the favorable bull run for the day we can assume 12.56$ ps close with swings up to 13.46 per share (new short term highs tested). However, there is growing sentiment that consolidation is expected between the 4 hr charts ranges, leading us to believe the likely close will tighten between 12.56 - 11.82 per share. Included with the horizontal range of 10.93 to 12.56; we have our lateral range, where we expect a pull back on Monday (News dependent) If major news (only) is announced a continued bull run will ensue.
