Aurora Cannabis Up 44% Amidst Volatility in the Cannabis MarketAurora Cannabis Inc. ( NASDAQ:ACB ) has been soaring to new heights in recent weeks, with its stock surging by a staggering 44% on Wednesday alone. The catalyst? The appointment of industry heavyweight Paul McCarthy as the president of the Cannabis Council of Canada (C3). McCarthy, with his extensive experience at Canopy Growth, brings a wealth of knowledge and strategic insight to Aurora Cannabis, propelling the company further into the spotlight of the rapidly evolving cannabis industry.
But what does McCarthy's appointment mean for Aurora Cannabis and its investors? Beyond the immediate boost in stock price, McCarthy's leadership signals a continued push for favorable regulations and industry growth. With his track record of driving corporate policy and international expansion, McCarthy's influence could prove instrumental in shaping Aurora Cannabis's future trajectory.
Aurora Cannabis's ( NASDAQ:ACB ) meteoric rise isn't solely attributed to McCarthy's appointment. The company has been riding a wave of positive developments, including the Supreme Court of Florida's decision to allow recreational marijuana legalization on the ballot and Germany's move towards partial cannabis legalization. These regulatory advancements hint at a broader acceptance and normalization of cannabis use, opening up new markets and opportunities for companies like Aurora Cannabis.
Moreover, Aurora Cannabis's recent acquisition of MedReleaf Australia for approximately $32 billion underscores its commitment to global expansion and market dominance. Coupled with a more than 5.0% year-over-year increase in revenue for the third financial quarter, Aurora Cannabis is demonstrating resilience and growth in a competitive landscape.
But Aurora Cannabis ( NASDAQ:ACB ) isn't the only player enjoying the cannabis stock surge. Tilray Inc. and other industry peers are also experiencing substantial gains, reflecting the overall bullish sentiment towards cannabis stocks. With Tilray Brands (TLRY) witnessing an 18% surge on Wednesday alone, the cannabis sector is outperforming traditional indices like the S&P 500 and Nasdaq 100, further cementing its status as one of Wall Street's hottest sectors.
The momentum behind cannabis stocks is fueled by anticipation surrounding the potential passage of a cannabis banking bill in the American Senate. This bill, already approved by the House of Representatives, could revolutionize the industry by providing access to mainstream banking services for cannabis companies operating in the US. Such regulatory clarity would alleviate the financial burdens and uncertainties currently plaguing many cannabis businesses, paving the way for accelerated growth and investment.
However, amidst the euphoria surrounding cannabis stocks, there remains a note of caution. The volatility inherent in the cannabis market, characterized by sharp price fluctuations and regulatory uncertainties, poses risks for investors. While major developments like the potential rescheduling of cannabis by the DEA could further fuel stock surges, they also introduce heightened uncertainty and potential for market turbulence.
21P trade ideas

send $acb back to $1002024 has been very busy for NASDAQ:ACB
- Aurora Introduces Medical Cannabis Pastilles for Patient Relief in Australia
- Aurora Completes Final Repayment of Convertible Senior Notes Representing ~$465 Million in Total Repayments Since 2021; Cannabis Operations Are Now Debt Free
- Aurora Partners with Script Assist to Provide Better Access to UK Medical Cannabis
- Aurora Cannabis Announces CFO Transition and Completion of Previously Announced Share Consolidation
when looking at the chart we can see obvious price discovery to the downside, and the last year of lows have come with heavy market selling. however on the plus side the buy pressure has been positive in the background suggesting someone is happy to scoop up the stock down here.
its only a matter of time before NASDAQ:ACB picks up again given the company are now debt free :-)

ACB will break $5 again!Based off recent positive sentiment backed up with the Elliott Wave strategy, if it follows 1,2,3,4,5 correctly, we'll see this stock break up to a little past the $5 mark!
I'm not a financial advisor ! I just like charting and playing with math :)

Aurora: One Step Away 👣The Aurora share continues to trade at the upper edge of our blue Target Zone between C$3.85 and C$2.58. In line with our primary scenario, the price should dip into this Zone. Within this range, we continue to expect the low of the color-matched wave (v) and thus the large wave (2) correction. Subsequently, we expect a turnaround and strong increases.

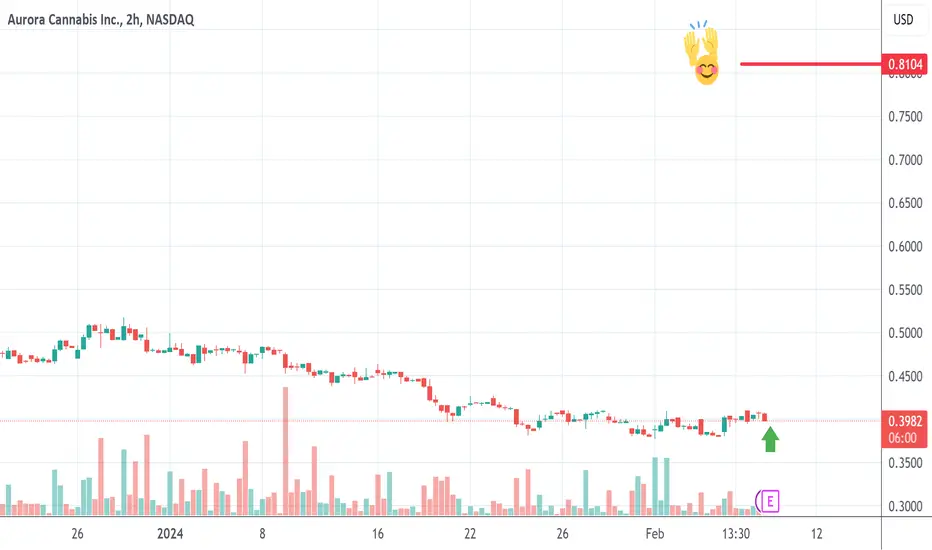
ACB Earnings Practice. Up 90%+??ACB earnings are in the morning, and Monday my dowsing really wanted to pay attention to this one based on the list I used.
It also had picked SNAP and said it would hit a new low. It's down 35% last I saw, so I want to post this idea for the journal of a stock my dowsing is choosing, not me.
I get repeatedly it's "safe to buy" and my intuition gave me a heart shape, which means up. Last night intuition gave me huge stars for SNAP, which is my signal for down.
I am also getting a number in the 90s, which I believe is percent.
My dowsing specifically gave the number 97 and said it's percent, which takes ACB to around $.818
The important thing to realize is that it will go right back down at some point, so could be played both directions theoretically. I get to sell rallies and spike up and reverse down.
That's about all. We'll see!
Ending diagonal?A giant falling wedge has formed on this one, and I've fitted an (ending) diagonal on the chart. I'd say it still has a bit to go on the downside and the best strategy would be to wait til' the wedge is broken to the upside. I circled the overbought RSI peaks (associated with huge volumes) a reminder that we could see those taken out in the future.

"Aurora Cannabis: Short-Term Bearish, Eyes Massive Bull Run"Analyzing Aurora Cannabis Stock: Tight Compression Forms Massive Falling Wedge
Aurora Cannabis stock, a prominent player in the cannabis industry, is drawing attention from investors as it undergoes a significant chart pattern characterized by a tight compression formation from a six-year retracement, resulting in a massive falling wedge. Despite recent attempts by bulls to break out, the stock faced rejection at $1 and is currently breaching short-term support levels. While we advocate for long-term accumulation, short-term projections suggest a potential shed of 10 cents per share, presenting an absolute buy opportunity. Let's delve deeper into what Aurora Cannabis stock represents and its current market dynamics.
Understanding Aurora Cannabis Stock
Aurora Cannabis is a Canadian cannabis company that specializes in the production and distribution of medical and recreational cannabis products. With a focus on innovation, quality, and sustainability, Aurora Cannabis has established itself as a leading player in the burgeoning cannabis industry, catering to a diverse range of consumers and markets.
The Tight Compression Formation
The tight compression formation observed in Aurora Cannabis stock is indicative of a period of consolidation and indecision among market participants. This compression has formed over a six-year retracement, culminating in the creation of a massive falling wedge pattern. Falling wedges are bullish reversal patterns characterized by contracting price ranges and declining volume, typically signaling a potential breakout to the upside.
Recent Breakout Attempts and Short-Term Outlook
Despite recent efforts by bulls to break out of the falling wedge pattern, Aurora Cannabis stock faced rejection at the $1 level, highlighting the presence of strong resistance. The failure to sustain momentum has resulted in the breach of short-term support levels, indicating a period of uncertainty and potential downside pressure in the near term.
Accumulation Opportunity
While short-term projections suggest a potential shed of 10 cents per share, we believe that Aurora Cannabis stock presents an attractive long-term accumulation opportunity. The fundamental strengths of the company, coupled with the growth potential of the cannabis industry, position Aurora Cannabis for success in the years to come. As such, investors may consider utilizing the short-term downside as an opportunity to accumulate shares at favorable prices.
Conclusion: Navigating Aurora Cannabis Stock
In conclusion, Aurora Cannabis stock is undergoing a significant chart pattern characterized by a tight compression formation and a massive falling wedge. While recent breakout attempts were met with resistance at $1, the breach of short-term support levels suggests potential downside in the near term. However, we view this as an opportunity for long-term accumulation, as the fundamental strengths of Aurora Cannabis and the growth prospects of the cannabis industry remain intact. Investors should exercise caution and consider their risk tolerance when navigating the short-term volatility of Aurora Cannabis stock.

Aurora: One last dip 💦The Aurora share is close to the orange Target Zone (coordinates: C$0.52 - C$0.49) in order to underpin the low of the same-colored wave b. We then expect the orange wave c to complete the blue (iv) much higher in the chart before the blue wave (v) can finally complete the overarching corrective movement of the beige wave II.

ACB callsI’m bullish on this stock my target price is 1.00 ,I’ve seen proper confirmation over this year and I think now is the time to make a move on this asset

Aurora: Electrified ⚡Aurora continues its electrifying trajectory. The price dipped further into its inactive target zone during the last trading week and is now visibly striving to resume the primarily expected uptrend. These efforts should soon yield bullish results. Aurora’s next target, the resistance at C$1.59, lies approximately 60% away. This resistance must be surpassed to grant wave (1) in magenta, its well-deserved peak a bit higher. An intermediate correction is expected to pull the price back slightly.

ACBMONTHLY TRENDLINE BROKEN “Cannabis Stocks to Explode” by Awaken Soul🖤 #investor #investing #cannabis #weed #cannabisstocks #weedstock #weednews NASDAQ:ACB NASDAQ:CGC NASDAQ:TLRY #stockmarket ACB

ACB Aurora Cannabis up over 60% to tangible book value levelACB along with other cannabis stocks are up this month on news that marijuana may be reduced down to a lower schedule level.
News headline : "On Tuesday, August 29, the U.S. Department of Health and Human Services (HHS) in a historic move officially recommended cannabis' controlled substance classification be changed from Schedule I to Schedule III ".
This was the catalyst that moved the cannabis stocks, including the other stock I cover GTBIF.
Unlike GTBIF (green thumb industries), ACB is not positive cash flow and is only interesting because of its tangible book value from the balance sheet. Tangible book value is assets minus liabilities minus intangibles, so the more "hard" real assets.
Up until last week, ACB was trading at around half its net tangible book value on the balance sheet. Because investors were pricing ACB as a wealth destroyer, they were discounting the value of the business to less than the net assets on the balance sheet.
Well today things changed.
The stock is up between 60-70% during live trading and even surpassed the net tangible book value, (shown on the chart as the yellow line).
It is good habit to always check to see the net tangible book value of your stocks to see if its cheaper or more expensive than you think. Look for "Tangible book value per share" on your trading view platform, one of the great many features here on Trading View.
Cheers.

Get ready for a pumpVery bullish setup on ACB today, a Wyckoff spring (liquidity tap) has formed. We have a nice "b" volume profile with lots of volume imbalances at higher price levels. On top of that the MACD histogram is showing a bullish divergence.
I have marked potential take profit areas (pink boxes).

🌴 ACB SELL THE BREAK 📉ACB has been falling for quite some time.
It currently appears that there may be a bearish running flat with a fantastic direction of trend entry!
Never forget to manage your risk and never break your own trading rules!

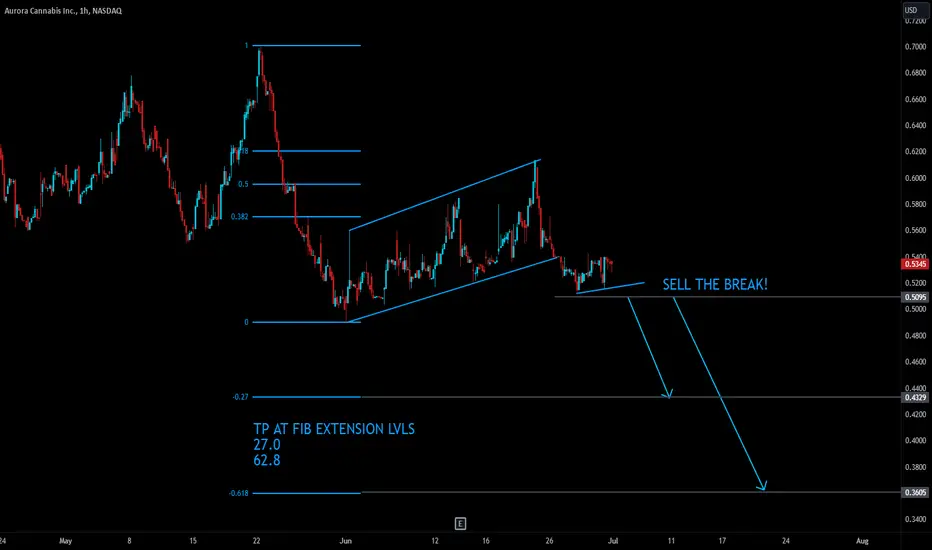
📉 SELL #ACB TREND CONTINUATION 🥦Hello, traders!
This chart has taken a beating as coming from a high of $150.00 to now currently it is at $0.53 per share. A decrease of 99% and it appears, it will continue.
What we are currently looking at is a bearish channel, an indicator of consistent downtrend, and has broken out on the 1 hour time frame, signaling an intensification of the bearish trend. Now is the time to strategize.
We need more confirmation before entering a short. When this flag breaks, I will be short #ACB and I will be taking profits at the main impulse fib extension 27.0 and 61.8.
Manage your risk, follow your plan and document your results! :)
ACB in bearish downtrend all year 🥶question is does earnings report Wednesday help us breakout or give us another rejection from trend resistance?
break of trend/zone resistance levels around .70 and we could easily rally 50-100%+🚀
bad ER and the downtrend its been in all year continues.. 20-50% more downside if we fail to breakout🐻 I may enter lotto long right before earnings no position yet though
boost and follow for more.. thanks ❤

ACB Aurora Cannabis Long SetupOn the 4H chart ACB has dropped out of a head and shoulders pattern list winter with high
volume into a downtrend with lower volume now into support / demand as shown by the
Luxalgo indicator. The anchored VWAP is also trending downward with support at the minus 1
and minus 2 standard deviations. The volume profile shows the majority of the recent share
exchanges have been at the $0.65 per share area. If price rises above that POC line of the
profile, ACB will get the attention of new buyers while short sellers will begin to cover thus
causing buying pressure and momentum. I will buy a sizeable quantity for perhaps $1-2K shares
once price gets over that POC line. Prospective buyers will consider this to be a reversal
confirmation. I will be one of them. The first target is the volume void at $0.79 or about
25% with the other target being one standard deviation above VWAP at about $.90. Stop loss
will be set at $0.05 below the entry. For profit insurance I will hedge with a single put option
contract at a strike of $0.70 with a 90-120 DTE to diminish risk at a minimal cost.

Aurora: Floating 🌊Aurora is floating and relaxing in our turquoise zone between $1.19 and $0.55 and has drifted below the 61.80%-retracement at $0.95. Although the share could finish wave II in white anytime as it has sufficiently tapped the turquoise target zone, we rather expect Aurora to sink a bit deeper still to conclude the current movement. However, by the bottom of the turquoise zone, the share should establish the low of wave II in white and subsequently turn upwards, heading for the resistance at $2.15.

Classic ABC correction for ACBWe should have a big wave up testing the 200 day MA and the VWAP resistance. I am expecting volume to gain momentum with this wave up. Let see what happen.

ACB, 3yrs UP, 4yrs DOWN, time to send itACB over the last 4yrs has tanked from its ATH, stock is now under $1. hopefully the next 3-4yrs produces something special. ih&s to develop at the bottom and recover the POC before testing $10 area


Aurora Cannabis finally moving north ?Looks like it, we have another touch of the bottom of the wedge and bullish divergence on MACD. A first potential target zone is around $1.50-$1.60 and second target zone should be a double top at around $1.90-$2.0.
