Not in the stockNot in the stock but you never know, bull flag an think we have some upside here Gl everyone 👍👍,🕺🏻🕺🏻🕺🏻
21P trade ideas

ACB Short Squeeze! 70% short ratio! 👉Why $ACB short squeeze is the Next $gme $amc ACB has over 20 million short shares, and with daily short volume above 50% (yesterday was 70%❗) this means it's just the shorts trading with the shorts. (shorts are selling to another short that's covering⚠️) and with the stock near historic lows, it's due for a massive rip/ short squeeze up.
-Market cap is slightly above cash levels, so it's dirt cheap
-recent acquisition makes the company instantly positive ebidta
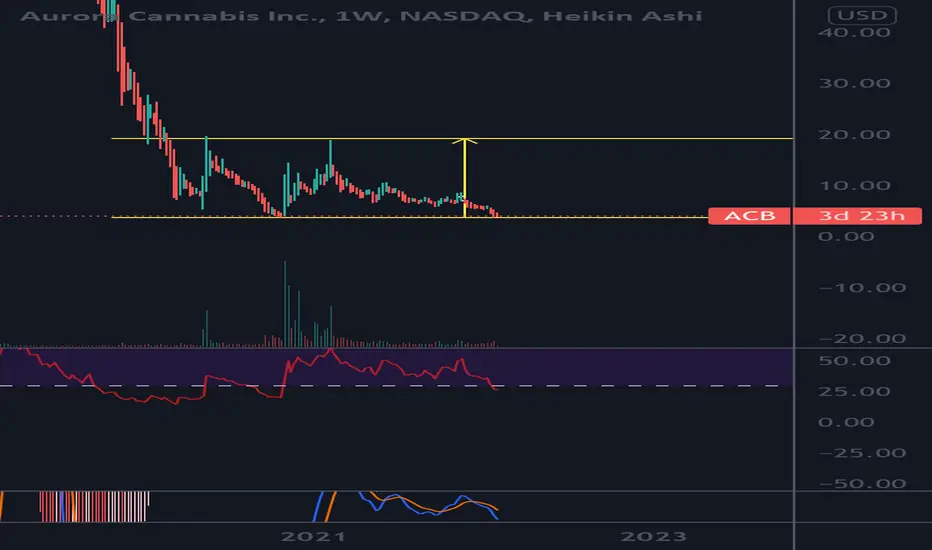
-breaking out of long term falling wedge
-near all time lows
-yahoo message boards full of short bashers (indicating lots of shorts to be squeezed)
Load up a few shares

Aurora Cannabis (ACB) found a bottomAurora Cannabis (ACB) found a bottom according to the Fibonacci circles and Pitchfork, the potential top is anywhere from $10.40 to S13 on the upswing from the low of 2.89. Targets are in black at the horizontal lines.

pot stocks waking upman this looks bottomed out, 3 long term targets highlighted if we can push back to the $5 region

Aurora Cannabis (USA: $ACB) Ready To Get High! 🌿 Spring 2022Aurora Cannabis Inc. produces, distributes, and sells cannabis and cannabis derivative products in Canada and internationally. It also engages in facility engineering and design, cannabis breeding, research, production, derivatives, product development, wholesale, and retail distribution activities. The company produces various strains of dried cannabis, cannabis oil and capsules, and topical kits for medical patients. It also sells vaporizers; consumable vaporizer accessories; and herb mills for using CanniMed herbal cannabis products, as well as grinders and vaporizer lockable containers. In addition, the company engages in the development of medical cannabis products at various stages of development, including oral, topical, edible, and inhalable products; and operation of CanvasRX, a network of cannabis counseling and outreach centers. Further, it provides patient counselling services; design and construction services; and cannabis analytical product testing services. The company's brand portfolio includes Aurora, Aurora Drift, San Rafael '71, Daily Special, AltaVie, MedReleaf, CanniMed, Whistler, Woodstock, and WMMC. Aurora Cannabis Inc. is headquartered in Edmonton, Canada.

Aurora Cannabis is stoned again. ACBGoals3, 2.75, 2.36. Invalidation at 6.07.
We are not in the business of getting every prediction right, no one ever does and that is not the aim of the game. The Fibonacci targets are highlighted in purple with invalidation in red. Fibonacci goals, it is prudent to suggest, are nothing more than mere fractally evident and therefore statistically likely levels that the market will go to. Having said that, the market will always do what it wants and always has a mind of its own. Therefore, none of this is financial advice, so do your own research and rely only on your own analysis. Trading is a true one man sport. Good luck out there and stay safe

Buy $ACB - NRPicks 11 FebAurora Cannabis Inc. produces, distributes and sells cannabis and cannabis-derived products in Canada and internationally. It also engages in facility engineering and design, cannabis breeding, research, production, derivatives and product development.

will get bloody if we reject here 👀acb is at this strong trend resistance! if it can break above this and local resistance my target is 5.46-6.17, if we reject then look for a test of local trend support then strong support next (3.75)
like and follow for more! 💘

$ACB Aurora Cannabis 35% Potential LongRetest the level lost on the daily. If gain continuation up. Fail, continuation down. Stop loss below weekly level. (Also earnings next week)

ACB 1W Continuedtest
Aurora Cannabis, Inc. engages in the production, distribution and sale of cannabis products. It also produces and sells indoor cultivation systems and hemp related food products. The company was founded by Terry Booth and Steve Dobler on December 21, 2006 and is headquartered in Calgary, Canada.

Holding adding to potfolio when can 23 and got kids FMLHolding i know a dang RS WILL HAPPEN :/ b3cauee i know it will just hold baby

Acb Got to st the volatility is real. It love to trap people up above 9-10$ and up. People
Don’t want to buy this at 4$ but love to get bullish at 13-18$
Don’t be a pig and get slaughtered.
Buy this lower channel and swing it up. I did I last time in the 3s got rewarded huge. Her we are god gave another gift Channel is from 3.50s - 14$. And we hav now had 2 wicks prior to 19.80s.
This could be a great swing to hop on and stop it below 3$. 1$ risk 12$ reward at least
$acb ride or die - gaps up to $100+$acb bottom in?
long term trendline with plenty of upside potential.
tons of gaps above with a couple of tricky monthly resistance blocks.
1R:13R
(daily gaps highlighted as grey dotted lines)

ACBEpic Fail, but It teaches you about indicators and your line in the sand to exit a trade. If I did not have those habits I would of been bag holding.

ACB not the best choice to play up move nowWe broke the support zone, too low now to short and too early to buy. I'd wait to be in the area 3,80 USD-4,00 USD to buy with a tight stop like 3.72 USD and target near 5.50 USD.
If the Nasdaq100 go up in the next hours and resume an uptrend, ACB not likely to go under 4.50 USD then buy around 4.50 USD -4,80 USD with a target 6.50 USD
That's my idea looking the chart today

ACB Swing- Tried to break out and failed in previous days.
- needs to follow the bullish trend line I added. Above it bullish. Below it is Bearish.
- Watching red zone territory. Daily Minute chart can be sketchy at times, but a zoom-out look on the daily it's still sticking to the plan.


A C BThis is a setup I have been watching for quite some time now. If you blink at the wrong time, you'll quickly realize why.
To me, ACB looks to be in a gigantic inverted head and shoulders pattern, with the right shoulder being close to completing. (Assuming the 5-3-5 pattern shown on my recent TLRY idea is correct, anyway.)
The accumulation phase for the right shoulder has been in progress for over 7 months. This is a *very* big right shoulder.
To give you an idea of how explosive this move for ACB could be, let's take a look at something I personally experienced: Bitcoin!
At the beginning of 2019, Bitcoin formed an inverted head and shoulders pattern.
-The left shoulder took approximately 3 weeks.
-The head took approximately 1.5 months.
-The right shoulder took 37 days. For Bitcoin, that is a very long time. Clearly, the right shoulder was extended for accumulation purposes.
Bitcoin went on to have a serious parabolic move from $4k to almost $14k after that pattern completed.
Since I began my painful journey in trading/investing, I have only seen less than a handful of right shoulders extended like this.
In ACB, we are staring at a right shoulder that has taken over 400% more time for accumulation than the one in Bitcoin did.
Imagine...
The neckline for this pattern resides at around $19. Considering that fact, traditional TA suggests two measured targets for this move.
If we measure just dollar amount, we get a target of $33.88.
If we measure percentage amount, we get a whopping $89.82.
This move may take some time to materialize and there is a strong chance there is still downwards momentum yet to come considering trend line resistances in both price and RSI.
The micro picture suggests however that this may be the very very beginning of this move materializing.
WHEN the right shoulder is complete, expect a very high volume and extreme move price-wise to the upside. This move will likely come with strong bullish news.

$acb new road map and the future of cannabisMake it legal and BOOM! $acb new road map and the future of cannabis

accumulation area Price is close to what can be a support zone, we could buy between 5.85$ and 5.50$ and expect price go up to 7.50$ in the next weeks. Such strategy need a tight Stop around 5.40$ because if we break the support line, price may head to the 3.80$ area i.e. 2020 lows.
The price movement (up or down) will depend on what the Nasdaq index will do in the next days, Xmas rally or Omicron fear.

Acb I was looking deeper into Acb as I got stopped out of my trade i entered at 7.66$. I was expecting a back test of 7.57 range but we fell right through. So I dove deeper and came up worh a monthly pattern. Now we seem to have a HUGe symetrical triangle with little time left in this The target of this is 21$. As we can see the downtrsndinf reistance has held us down so much even during the run to 20$ we couldn’t close above. At this time that resiatnce is around 9$ which means breaking and closing a weekly body above 9$ and opening a powerful candle with volume can be an amazinf of trade Lower symetrical uppprt is 6.15 so stops below 6$ or just watch we don’t break and close below. I’m still bullish but anything can happen. I did add some postion around 7.08$ to test this idea with stoploss at 5.99 Good luck !
Remeber nothing is gaurenteed in trading

#ACB Target :$10.42-11.78-12.46
Resistance 2 : CAD 12.46
Resistance 1 : CAD 11.78
When Break the Level $10.42
Support Level 1 : CAD 8.99
Support Level 2 : CAD 8.56 (possible Start)
Support Level 3 : CAD 8.16
**Disclaimer - This is not a financial advice, please trade with caution and on your own risk. This prediction Based on My Dreams.
Do not view this idea as a recommendation for trading or investing. Risk Only What You Can Afford. Always Use a Stop Loss. Past performance is not necessarily a guide to future performance.
I would appreciate your feedback on my analysis.
Cheers

ACB potential wave 3 up?Elliott wave counts can be very subjective with some people's counts being completely different. I have two potential counts set up for ACB. My count I'm leaning more towards is the GREEN count.
Following the Green EW count, we see the price come just about to the pink weekly resistance line. In EW theory, wave 3 is the strongest move and known for the "gap up" movements. These gap ups generally occur to break through a resistance line. This makes since and would follow that the pice movement up to weekly resistance would be wave 1 and we are currently in a wave 2 pull back, potentially setting up for a nice wave 3 movement up to break through the weekly bearish resistance line. The green wave 3 projection coincides very well with the weekly Supply zone, potentially indicating where a pull back could occur for green wave 4.
As I said, there are always different counts; or "Alt Counts." The yellow count is just that and also has supporting indications. In favor of the yellow count is the potential of a back to back .618 retraces, which a lot of EW traders like to find and make decisions of entry points from. We can see a yellow wave 2 retrace to .618, meaning we are in yellow wave 3. There has to be 5 waves to make up yellow wave 3, which, this pullback could indicate we are in a smaller degree wave 2 retrace that is just hovering above a .618 retrace that comprises the overall yellow wave 3 movement.
End of day, if going off these counts, both support a movement upward in my opinion.
