Thetagang rise on OPENI like the set up and the movement within the fib. I'd go long once the two lines meet.
25M trade ideas

$OPEN - keeping a close eye on it It's an IPO, so chaos runs through its veins.
It still looks like it wants to take a blast off.
Watching it for entry, I am undecided if I will choose call options or commons.
I've been buying more commons than options due to an expected pull back that I predict will come around mid February 2021

OPEN - Breakout and Golden Pocket Fib ReversalPotential bottom at $21-22, rejection of the 0.618 golden pocket fib for a move up out of the falling cone. Double hammerheads on the daily as well. May see consolidation up to the ichimoku cloud for 1-3 weeks before a significant move up, similar to SPCE price action in the last month.

breakout to the top channel nice long here if we use a tight stop, long 28, sl 26.2, price target 32

THE UBER OF REAL ESTATE SALESrecent IPO so HIGH RISK but the business idea is one familiar to all investors as being sorely needed in the marketplace. amazing revenue growth and giant TAM potential BUT VERY SMALL MARGIN business. amazing disruptor with strong management. i bought as it was ready to move above 20dma after a quick test and rejection of the 50dma.

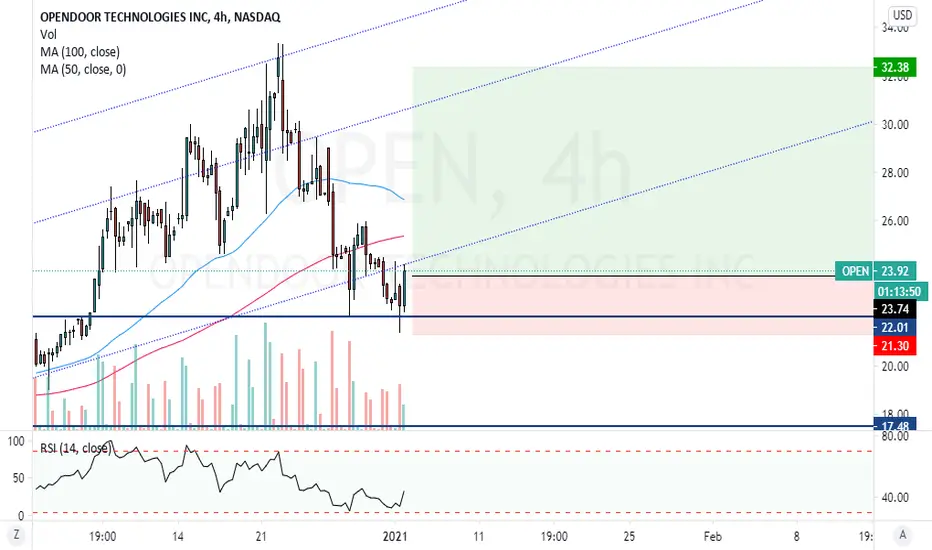
OPEN 04-01-2021 LongAsset and Time frame -OPEN,4H
Entry Price -23.79
Exit(Stop Loss) -21.30
Exit(Take Profit) -32.38
Technical Analysis - Daily chart reached a significant support line and the 50MA,making a hammer like pattern on the daily(depends on the close), on the 4H chart the RSI couldn't get to oversold(and a hammer + confirmation pattern again), price will get back to the daily channel and return to the uptrend.
I would like to hear your opinions and what can I do to improve, many thanks
Beautiful daily hammer - bullish reversalWe are long on this after this pullback - excellent daily hammer for a bullish reversal bet.

$OPEN OpenDoor Tech Makes Very impressive Reversal
A huge selloff finally found support yesterday on Fibs' and
the gap fill level, resulting in a 13% intraday reversal.
First major target to cross today is $27.00 (previous pivot)
$29.46 is a previous resistance levels which should act as
a good target in any reversal.

OPEN - New Swing TradeLooking to play this hammer. I will close out of the position before Feb 1st, 2021.

Opened a position in $OPENOpened a 1/15/21 Call today on $OPEN set up is simple, looking for OPEN to stick to trading in its channel, sticking to target fib levels


$OPEN, Zillow, and Redfin correlation and long term bullishOpendoor broke trends today during a period of limited/no support (See related ideas section).
I look to RDFN and Z for wider market trends. These 3 companies are in a similar tech real estate market. There is limited trading history for OPEN and IPOB, TradingView doesn't even allow charting properly. There is a correlation with patterns for RDFN and Z, but there has been higher volume with OPEN. Using 1H ichimoku, both Redfin and Zillow are bullish and have no trends broken. Z is actually slightly positive since the OPEN ticker change. I expect OPEN to get back on a bullish 1H trend once the early stakeholders complete their selling.
This is an accumulation level and it could gain momentum fast as people accumulate. I would like to see a bullish 1H trend since the new ticker launch, which could at the earliest be established during the first week of January, before I recommend going long.

