PYPL Oversold!Fairly bold post considering today was PYPL's worst ever trading day but... I see a reversal in PYPL's downtrend incoming. The RSI is indicating that shares are far oversold on the weekly chart. As shown above it is approaching pretty solid support which could serve as an entry.
Just speculation...
2PP trade ideas

Support @ 129Breakout 0 - very long term POC at 89
Breakout 1 - long term POC at 106 and 189
Breakout 2 - near term POC at 189
Peak 1 - POC at 189
Peak 2 - POC at 189
Support 1 - 129 - should hold, unless SPY goes into correction
Support 2 - 106 - will hold in case of SPY correction
Plan A:
Enter - Buy long term - at 129 if this breaks exit at 10% loss
Target - 189
Plan B: if 129 breaks
Enter 2 - Start buying long term at 106
Target1 - 129
Target2 - 189

PYPL Breaking Down through Support Today I am discussing Paypal Stock which has been drastically sold off around 40% from highs! I do think this is crazy, and oversold. BUT, I am going to analyze stocks appropriately and without any bias.
PYPL as shown on the Daily Chart has been breaking down through this Range it has been trading in of where I have a Rectangle shape Drawn.
PYPL just closed underneath that rectangle 2 days in a row, and even rejected off that bottom of the Rectangle on Friday. That shows Strong Resistance at that level.
PYPL also broke its Support from its previous breakdown @ the $179.20 area (White Line)
PYPL has 1 wick left from the candle on Jan. 10th and then of course further back supports.
But I think the range it is breaking out of now, is something to note down of not being a small break down. The reason I am saying this is because PYPL has now been in the sideways trading for around 2 and a half months. PYPL is now ready to make a bigger move, but here it seems that bigger move may be to the downside.
Here are EXTRA Reasons why PYPL is a good SHORT idea here.
TTM_SQUEEZE - Squeezing (red dots) indicating big movement of momentum coming. + Momentum Switching to Bearish.
Broke Down and even retested the Rectangle range.
Broke Previous Breakdown support.
GAP to fill at the GREEN Rectangle ($130s) area.
A lot of stocks like to always fill the gaps... and I know its a stretch to say hence it is a long time ago, but with bearish momentum this stock could easily fill that gap.
Some contradicting indicators to this SHORT idea
TTM_SQUEEZE (WEEKLY) - WEEKLY Still showing weakness, but appears to be wearing out, and fading to the bull-side.
WEEKLY moving average cloud.
Still some more key levels to be breaking
I hope you guys enjoyed this idea! Share it if you liked it!
If I do play this I will be looking in to Liquidated March & or April Puts near the $140 strike price.

$PYPL potential bottom (3/5)Conviction: 3/5
Thesis
Reached trend support (2016)
RSI-D showing potential bullish divergence...
Touched 0.786 retracement too, confluence could be powerful
P/S is high on absolute scale (S&P 500 P/S is about 3), but nearing lows of Feb 2020
Risks
Short history, does not contain last major recession in 2008
RSI-W super low (18) but in historically uncharted territory...

PYPLI guess the positive here is that the gap from May 2020 was filled on the highest volume day in company history? For whatever that's worth. I'm not touching this thing but could see a dead cat bounce if $130 holds imo.

PAYPAL reached its Fair Value. Will it make the bleeding stop?PayPal has seen an extreme sell-off this week so far, the last series of the correction since late July. By doing so, the price has almost reached the bottom of its 'Fair Value Zone' which is practically the Higher Lows trend-line since the January 2016 market low.
Every prior touch on that line has been a long-term buy in the past, with PayPal starting a long-term rally to a higher Fibonacci extension every time. Do you think this Zone is enough to attract buyers again and stop the bleeding?
--------------------------------------------------------------------------------------------------------
** Please support this idea with your likes and comments, it is the best way to keep it relevant and support me. **
--------------------------------------------------------------------------------------------------------

how long does it take to pull back from this priceevery thing shows that we will have a strong pullback.
Just look at the RSI chart in weekly priod.Even at the covid19 decline, RSI couldnot go under 30.But now its hitted 18 !!!
The other point is volume.The volume of trading was over 115 M.
What does it mean? The profesional trader are just buying...

Earnings 2-1 AMCThis particular stock analysis has been in the back of my head bugging me for a while.
I decided to look at it again and remembered it was in a rectangle a while back and broke to the downside. So I still had those targets on an old chart.
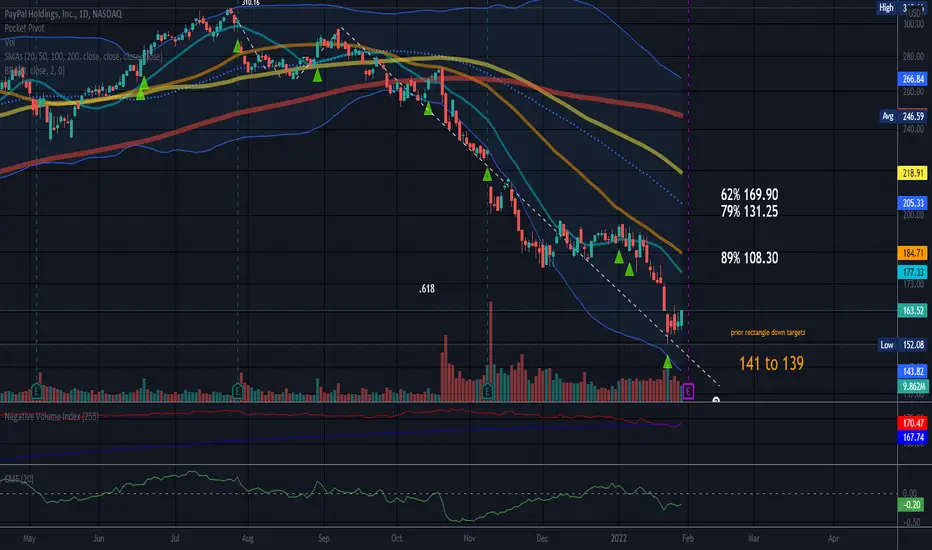
Then I tried to apply fib levels today and found it very difficult to stretch the fib table from the beginning of the impulse wave (white line to far left) from the bottom all the way up to the top, which is usually not such a stretch! Now that I look at it on weekly and monthly, I do think a big part of that impulse wave up was a parabolic arc as it is very steep.
Not an unusual finding as there were many ARCs formed in the last 2 years. Most ARCs fall between the .618 and the .786 fib levels on the fall back to earth. An arc can fall less or more than these levels. PYPL is between those 2 levels right now. It has already passed the .618. Parabolic arcs can be volatile for quite a while after falling and are caused by extreme bullishness. First this one needs to find a place to rest.
Earnings are very soon so not the best time for me to figure this out for myself, as I do like this stock. I will wait and see what earnings bring.
No recommendation.
Only those who are asleep make no mistakes )o:
PayPal Rare Buying Opportunity. Extremely OversoldPaypal is in the extreme oversold territory after an overreaction to their slightly disappointing earnings. It's also at the 0.618 fib for its macro wave making me particularly bullish on an entry here. Of course DYOR.

Paypal buying opportunity for long term holdPaypal is back at support, it will grind the support level for 1-4 weeks, then we will see accumulation for 2022 hype season that will be on second half of the year.
CCC.io

opportunity!!!Ok, i think that somebody is dramatic about the paypal results, i think is a good company, everybody is using paypal now, it's international and there is a huge gap inside in a downtrend that is almost finished. our AI is forecasting a 50% in the near future.

PYPLSelling 2x units 11FEB22 120-130 area puts and buying x units 11FEB22 140-150 area calls. Will add to both sides on 123 fill (if it comes), but quickly cut if clean break lower. Otherwise, looking for it to levitate above 130 and possibly for near term 150+ print.

PYPL for a bounce play or LT.Adding PYPL for a bounce for over reaction, add mayor support. Chart doesnt have to be very technical for the obvious

Paypal full cycle
PYPL - Elliott Wave Analysis
From the first day of listing we see a 5 waves up, an impulsive wave up, with something very interesting: Wave 5 is almost a truncation or failure. Which it meant that the fallowing correction will be very dramatic.
That is exactly what it happened.
From the top of wave 5 $309 price we see a big drop the unfolding correction. So far we had wave A subdivided in 5 waves as in the graphic above, Wave B corrective subdivided in a-b-c-d-e traveling sideways.
I see Wave C unfolding in 5 waves down. With the bottom in the region of $68-$83 supported by the guideline of equality between waves A and C and the previous support held by the price.
Disclaimer: This is my analysis and does not constitute financial advice.
If you want more stock analysis like this please send me a message.

PYPL - bullish divergenceGood long here @ demand zone for PAYPAL. Heavily oversold
Target is $230-$240

HUGE Long-Term BUYING opportunity on PayPal #PYPLWe've just opened a LONG #PYPL (PayPal Holdings) position using 2.50% of our equity as we believe that the current post-earnings sell-off is quite overdone at these levels.
The stock is down over 58% from its all-time highs of $310 that it reached mid-summer last year. Our view is that while there are definitely issues related to the future growth trajectory of the company that investors are rightfully worried about, the current price action is pricing in the worst possible scenario for the company moving forward, which in our opinion has a very low probability of actually materializing. Furthermore, the weak forward guidance and the severely lowered investor expectations will make it that much easier for the company to beat its own forecasts in the coming months, considering its leadership position in its sector, thus surprising the street positively. This will then cause a chain reaction of positive analyst upgrades and price target revisions. Yes, this whole process might take some time to materialize, but if you are looking for a solid growth stock with a remarkable long-term potential to double your money, then #PYPL is a screaming buy anywhere around the $125-130 range.
There is no question about the fact that the miss on the bottom line (EPS) in the most recent earnings report together with the poor forward guidance that the management gave on the earnings call after have been the major drivers for the vicious sell-off that we are seeing today.
For 2022, management expects net revenue to increase about 15% to 17% (19% to 21% ex-eBay), and that’s below the roughly 18% analysts were forecasting. The earnings outlook wasn’t any better, with management forecasting adjusted earnings of $4.60 to $4.75, well below analyst estimates of $5.21.
On the new users front, PayPal expects to add about 15 million to 20 million net new active accounts this year, and analysts were forecasting growth of about 55 million. This was definitely one of the most disappointing components of the report.
However, we believe that the down-beat forward guidance given by the company is hugely blown out of proportions and it seems that investors have been very quick to forget that #PYPL is the leader in the digital payments space and could technically be considered as the largest digital bank in the world with over 300 million clients. Our analysis shows that the eBay transition that the company has been going through has definitely weighted on its financial performance. However, we are in the final stages of it and it will be over and done with by the second half of the year.
What investors need to focus on is the fact that the company’s growth rates excluding eBay have remained above 20%. In addition to that the #AMZN (Amazon) partnership with Venmo hasn’t even started yet, and PayPal is free to explore many new partnerships now that it is no longer constrained by its relationship with #EBAY (eBay) . Also, operating expenditure growth is also expected to moderate down the road, allowing management to flex the leverage in the business model and help expand margins.
Apart from adding the stock to our long-term corporate investment portfolio here, we've also opened few long-term CALL options on $PYPL, which we expect to substantially boost our portfolio returns in 2022.
Follow and copy us for more detailed market analyses, profitable trading ideas and a consistent portfolio performance.
Sincerely,
@DowExperts


What is the common feature between PayPal, Block, and DocU?The simple answer is ARK invest and social media Fools ..!
When on February 28, 2021, I wrote the article:
The Social Media Trading Bubble comes to its end..!
These kids (generation Z) called me PERMA BEAR..!
After 339 days you can read that and if I were right or wrong..!
I think most of them are now Near Margin Call if they have not been wiped out yet..!
I am pretty much confident that this phenomenon will be called the "Social Media Bubble" in the future..!
Do not be angry with me, be angry with those who offered these and promised you a trip to the Moon..!
Best,
Moshkelgosha
DISCLAIMER
I’m not a certified financial planner/advisor, a certified financial analyst, an economist, a CPA, an accountant, or a lawyer. I’m not a finance professional through formal education. The contents on this site are for informational purposes only and do not constitute financial, accounting, or legal advice. I can’t promise that the information shared on my posts is appropriate for you or anyone else. By using this site, you agree to hold me harmless from any ramifications, financial or otherwise, that occur to you as a result of acting on information found on this site.

Gap Fill opportunity Hello Friends!
Took a position at $129.89 and looking to fill that $140 to $151 gap fill. That sharp selloff might find traders to fill that gap.
As always thanks for your follows, likes, and comments. Let’s learn and grow together. Cheers!

PYPL PayPal: 1D Chart ReviewHello friends, today you can review the technical analysis idea on a 1D linear scale chart for PayPal Holdings, Inc. (PYPL).
The chart is self-explanatory. Price dropped significantly and has the possibility for a retracement back up with the RSI in the oversold region. If price drops further, there is a strong support region below. Keep an eye on the 0.618 Fibonacci Retracement area if price moves back up.
Included in the chart: Trend line, Support and Resistance Lines, RSI, MFI, Double Top Pattern, Descending Broadening Wedge, Fibonacci Retracement, Death Cross, Simple Moving Average, Volume.
If you enjoy my ideas, feel free to like it and drop in a comment. I love reading your comments below.
I have additional charts below on cryptocurrencies, stocks and more to review. Check them out!
Disclosure: This is just my opinion and not any type of financial advice. I enjoy charting and discussing technical analysis . Don't trade based on my advice. Do your own research! #cryptopickk

Interpreting the PYPL fallPYPL has fallen ~25%, this provides a great dip buy opportunity. It is barely a dip but a pullback to a major trendline.
The falls can be attributed to each moving average, the first the 50MA (in green), the second the 100MA (in orange), and the third and current, the 200MA (in red)
Great buy

PayPal (NASDAQ: $PYPL) Just Closed Gap @ 0.786 Fib! 💯PayPal Holdings, Inc. operates as a technology platform and digital payments company that enables digital and mobile payments on behalf of consumers and merchants worldwide. Its payment solutions include PayPal, PayPal Credit, Braintree, Venmo, Xoom, Hyperwallet, and iZettle products. The company's payments platform allows consumers to send and receive payments, withdraw funds to their bank accounts, and hold balances in their PayPal accounts in various currencies. It also offers gateway services that enable merchants to accept payments online with credit or debit cards, as well as digital wallets. PayPal Holdings, Inc. was founded in 1998 and is headquartered in San Jose, California.

Paypal Gaps Gap made in May of 2020 is not filled yet $130-$140 It might just come down to fill it. There is also a gap on the upside at $216-$224 could also be filled before or after the lower gap.
