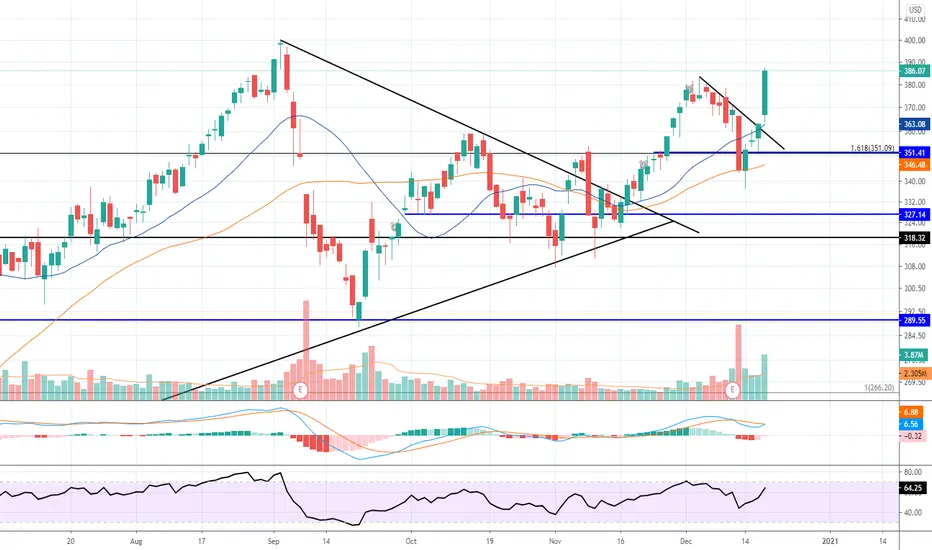
DunnoLooks like a bearish Gartley..
Strong stock so perhaps will not fall all the way to PRZ (Point of reversal zone)
Most harmonic pattern trade entries occur around “D” point within the reversal zone. It could be a Buy (in bullish patterns) or a Sell (in bearish patterns). Usually, “D” is identified by a confluence of projections, retracements, and extensions of prior swings (legs), universally called as “ point of reversal zone, and is abbreviated PRZ
A visual, geometric price/time pattern comprised of 4 consecutive price swings, or trends-it looks like a “W” on price chart.
The dreaded W..when a stock hits D in a harmonic pattern, sometimes there is a bloody pull back.
Must be valid ABCD pattern observed in move from A-to-D
Time from point XA and AD ideally in ratio and proportion
Limited instances where ABCD move completes at 100% of XA (double top)
Time of XA and AD should be equal for “true” double top
Pattern failure (price moves beyond point X) may indicate strong continuation move in progress
Price may move up to at least 127.2% or 161.8% of XA
Be safe on this one..Just an observation
33L trade ideas

LULU waiting for a reversal trendLULU waiting for a reversal trend.
Trade Idea: Jan 15 400C wait for it to test trend line ~343,345. Stoploss: 340

LULU is finally readyNASDAQ:LULU NOV 27 $350 call were alerted in the channel. Up over 30% TODAY! DM for details
None of the content published constitutes a recommendation that any particular security, portfolio of securities, transaction or investment strategy is suitable for any specific person. Information provided in this correspondence is intended solely for informational purposes and is in no way guaranteed. For financial advise seek appropriate investment advice from a licensed Industry representative.


Bounce of anchored VWAPGood trade today morning with strong RR. Bounce off the VWAP from the ATH.
The company reported strong earnings and sold off on Friday.
I hope someone caught it!

LULUAmazing break out with LULU is coming close to 52 week high after great break out. Not a good time to enter just keep a watch out on it


LULU about to breakoutI predict a bullish price action of LULU based on the following 3 indicators:
- A backtest of the triangle wedge followed by a clean bounce.
- A parallel rising channel which was unbroken during last week's sell-off.
- Chaikin Money Flow reversed but needs to follow through.

Buy the dip on $LULU after earnings?If past movement are not a guaranteed for future result, i did not get that memo... Because as it happened in the past, again $LULU had amazing earnings, beating both revenues and earnings and yet share are down more than 5% as this morning.
Here some number:
Revenue increased 22% to $1.1 billion
Comparable sales increased 19%, or 18% on a constant dollar basis
Diluted EPS of $1.10, Adjusted EPS of $1.16
IMO demand for athletics clothing will continue to rise. The mirror acquisition will guaranteed $LULU to take a piece of the pay from other player like $PTON and $APPL during lockdown orders.
Why am I bullish? On a technical prospective it seems to be holding well around 345-348 price. There are multiple factors for that:
1. Support at around 361$, 344$ and 325$. It seems to be holding at 348$ for the moment. If it does not, will be looking to buy at 325$.
2. Trend line still in up trend. It intersect quite well with support at 348$. That is why I bought some shares
3. Fibonacci retracement: also at around 348$ price.
Usually where there are multiple convergence of factors at once, stocks tend to do well.
In addition many analysts raise PT and reiterate their buying ideas.
AGAIN, past movement are not indication for FUTURE price actions. But $LULU seems to different :) Time will see.
This is not an investment advice. Do your own due diligence before investing.


$LULU with a neutral outlook following earning release The PEAD projected a neutral outlook for $LULU following a negative under reaction after earning release placing the stock in Drift D
If you would like to see the Drift for another stock please message us. Also click on the Like Button if this was useful and follow us or join us.


Lessons of LULU Earnings (also RH and ADBE)LULU had made symmetry advancement prior to earnings to the high of 383. A little turn downwards on MACD. The line in the sand of the first retracement is 61.8 Fib level which also is at 50 EMA.
RH had a similar reaction as well as ADBE.


LULU earnings 12/10 @ 4:05pmLULU designs and retails athletic clothing for women, men, and female youth. Its apparel assortment, including items, such as fitness pants, shorts, tops and jackets, is designed for activities such as yoga, running and general fitness. The Company's fitness-related accessories include an array of items, such as bags, socks, underwear, yoga mats, instructional yoga digital versatile discs and water bottles. Lululemon athletica Inc. is based in Vancouver, Canada.
3rd Quarter October 2020 earnings announcement is tomorrow on 12/10 at 4:05pm
Earnings Whisper $0.95
Consensus: $0.86
Revenue: $1.01 Billion
LULU is showing bearish signals on rsi, volume ema and price action the past four days, plus it sure looks like a variation of a shrunken head and shoulders, lol. With that said, it's all going to come down to the fundamentals in the end. If there's anything short of a +$ earnings surprise, expect LULU to tank post market tomorrow. If, on the other hand, LULU pulls out stellar earnings, the share price could pop. Because I don't know what the earnings are going to be, I'm taking a bearish perspective with caution. End result range is between $340 - 400, which is quite an unhelpful spread to forecast LULU 12/11 price action, so a low risk 4-option strategy could be best. What I have in mind is buy $370 straddle 12/18 (put = $1875, call = $1300, total = $31.75) and sell a $350-390 straddle 12/11 (put = -$7.95, call = -$4.85, total credit = -$12.80). One case scenario, LULU closes below $350 or above $390 on 12/11 and you receive a $2k credit, and because the original trade cost you $1895, you make $105 profit per contract (not a great gain, but no loss). Another scenario is LULU misses passing $350 on the down side or $390 on the up side on 12/11 and you've positioned yourself for all the price action next week by getting a straddle for -$1280 discount. And finally, the more likely scenario is you can liquidate the calendar spread 4-option strategy at any point in pieces as the price action permits. Do your own due diligence, your risk is 100% your responsibility. You win some or you learn some. Consider being charitable with some of your profit to help humankind. Small incremental steps work : If you double a penny for a month it = $5,368,709. Good luck and happy trading friends...
*3x lucky 7s of trading*
7pt Trading compass:
Price action, entry/exit
Volume average/direction
Trend, patterns, momentum
Newsworthy current events
Revenue
Earnings
Balance sheet
7 Common mistakes:
+5% portfolio trades, risk management
Beware of analysts motives
Emotions & Opinions
FOMO : bad timing
Lack of planning & discipline
Forgetting restraint
Obdurate repetitive errors
7 Important tools:
Trading View app!, Brokerage UI
Accurate indicators & settings
Wide screen monitor/s
Trading log (pencil & graph paper)
Big organized desk
Reading books, playing chess
Sorted watch-list
Checkout my indicators:
Fibonacci VIP - volume
Fibonacci MA7 - price
pi RSI - trend momentum
www.tradingview.com


