Yoga PantsShort below 384
Initial target 327 by mid Sep 2023
Goal Target 300 by October 2023
P.S.
Yoga Pants are out, we do this naked now.
33L trade ideas

Ascending TriangleThe triangle is within a large rectangle.
Both patterns are neutral until broken.
Tough Resistance overhead.
Earning 8-31.
No recommendation.
52 Week Range
277.50
394.54
Day Range
375.00
382.72
EPS (FWD)
11.93
PE (FWD)
31.58
Div Rate (TTM)
-
Yield (TTM)
-
Short Interest
2.12%
Market Cap
$47.86B
Volume
229,228

Bullish Alert : LULUOn the 15 minutes chart, there is a good bullish alert with a bullish crossover.
This easy pullback may be over confirming the long term upside move.

LULU expecting 14.5%+ move for earningsI really have not been getting direction correct on these things since TSLA and GOOGL, but end up nailing the percent and dollar moves based only on my intuitive hits.
SO, full disclosure. I don't follow LULU. This ticker came to me when I woke up on the morning of the 18th with ROKU firmly in my brain, and LULU only slightly.
Of course, I wish I had taken it seriously enough to do a deeper dive on why I got ROKU, but I did enough dowsing to get the point move of 23 correct (post earnings) and that it would go down and then up (on daily chart).
I'm curious if LULU also has an extreme move, so here's what intuition gave me last night on it:
symbol of a heart = up (but could this be just for today since it's up?)
14 "and a half" - never heard such precision before from my guidance lol
and the number 82.
This morning, the high of the day so far is 382, which I thought would suggest a short. But, I've had very bullish energy in my dowsing. So, it could be by the end of the day, if LULU is OVER 382, it's a buy. If it's BELOW 382 it's a sell?
My dowsing also gave me the percent as 16, which very well could be at the extreme of the move.
If anyone has an options strategy for playing both sides for a move up or down, that's really cheap, I'd be interested. Thanks!

LULU put credit spreadmacro: snp500 QQQ uptrend
News: inflation flattening
TA : Break of ascding triangle
STOP: rolling till worthless options
TP: low value per day or expire
risk: UK inflation domino effect

$LULU has the room to go for $500Strong uptrend and earning gaps, great technical chart and wonderful strong up trend gives us clear view of upcoming move for $lulu..
We need first to clear 390 and 400 .
It might gap up strong on Thursday 29 2023 ..
Let's see!

RectangleTop line is resistance and price is just below the resistance line.
Entry long would be a break of 389.06 with a confirmed uptrend in place.
Rectangles are neutral until broken and can be a very long term pattern when the rectangle is large like this one.
No recommendation.

Roadmap to LULUBlue solid lines are established downtrends, green dotted lines are established uptrends. Both the uptrend and downtrend lines are established from equilibrium points, (not highs and lows). Thickness of lines illustrates strength of previous price action. Circles are the crossing of uptrend and downtrend (Crossfire Points), usually resulting in reactions.

Co inegration strategies on two pairs of stocks( re-upload )I had to re-upload this due to bad volume. This is how you trade based off of the dynamic equilibrium between two stocks within the same industry

Lululemon to breakdown from a wedge?Lulumelon Athletica - 30d expiry - We look to Sell a break of 355.85 (stop at 367.85)
We are trading at overbought extremes.
We have a Gap open at 29/3 from 320.31 to 366.25.
Trading within the Wedge formation.
The bias is to break to the downside.
Expect trading to remain mixed and volatile.
A higher correction is expected.
Our profit targets will be 325.85 and 320.85
Resistance: 374.06 / 380.00 / 386.70
Support: 370.00 / 356.50 / 345.00
Please be advised that the information presented on TradingView is provided to Vantage (‘Vantage Global Limited’, ‘we’) by a third-party provider (‘Signal Centre’). Please be reminded that you are solely responsible for the trading decisions on your account. There is a very high degree of risk involved in trading. Any information and/or content is intended entirely for research, educational and informational purposes only and does not constitute investment or consultation advice or investment strategy. The information is not tailored to the investment needs of any specific person and therefore does not involve a consideration of any of the investment objectives, financial situation or needs of any viewer that may receive it. Kindly also note that past performance is not a reliable indicator of future results. Actual results may differ materially from those anticipated in forward-looking or past performance statements. We assume no liability as to the accuracy or completeness of any of the information and/or content provided herein and the Company cannot be held responsible for any omission, mistake nor for any loss or damage including without limitation to any loss of profit which may arise from reliance on any information supplied by Signal Centre.

$LULU to 380Had a breakout from the symmetrical triangle, also had relative strength on a choppy day.
Trade idea : LULU > 374 target 380

Keep an Eye OutLulu obviously crushed earnings and the stock took off to the upside. But…. Keep an eye out for this trend line. If we get a clean break, we may go down quite a bit to fill the open gap. MACD also showing that we’re getting close to turning bearish.
Not financial advice, good luck to all :)

LULU 3/20/2023The ladies love their overpriced leggings, but the stock market doesn’t.
LULU Daily chart analysis.
Their uptrend started March 2018 and came to an end December 2021.
Price has since been moving side-ways in a Distribution stage in form of a Head and Shoulders pattern. We need is break of neckline before price enters downtrend.
Entering trade short
Entry: 281.00
Stop loss: 339.34, (-16.61%)
Target: 161.74, +44.42%, 2.67 RR ratio

LULU - Broken Failing Trend Channel- LULU has broken the ceiling of the falling trend in the medium long term, which indicates a slower initial falling rate.
- The price has risen strongly since the positive signal from the double bottom formation at the break through resistance at 325.
- Between support at 352 and resistance at 385.
- RSI is above 70 after a good price increase the past weeks.
- The stock has strong positive momentum and further increase is indicated.
However, particularly for big stocks, high RSI may be a sign that the stock is overbought and that there is a chance of a reaction downwards.
- The RSI curve shows a rising trend, which could be an early signal of the start of a rising trend for the price as well.
- Overall assessed as technically slightly positive for the medium long term.
*EP: Enter Price, SL: Support, TP: Take Profit, CL: Cut Loss, TF: Time Frame, RST: Resistance, RTS: Resistance to be Support LT TP: Long Term Target Price
Verify it first and believe later.
WavePoint ❤️

SHORT LULUWe had a fantastic earning report this week, but we must remember that not only LULU but every other stock moved higher this week.
It was not only because of LULU's earnings whole market is moving higher and closed March with a big statement. Now that we trading above 200 MA and 77 levels at RSI, LULU has to and needs to move down to find new higher low support to move even higher.
After all one thing, we learned this past few years you can't be too bullish and can't be too bearish. Stocks will go down and up all the time. In LULU's case, there is not much juice left to squeeze up, therefore stock needs to go down.
Currently stock is extremely overbought it's not sustainable to move higher at this point. My first target is around $340.

LuLu showing weakness after a group this week.
LuLuLemon showing weakness after a group this week. I see a huge opportunity in terms of filling this weeks gapup with downtrend starting now.

$lulu with a bullish outlook following its earnings #StocksThe PEAD projected a bullish outlook for $lulu after a positive over reaction following its earnings release placing the stock in drift B with an expected accuracy of 100%.

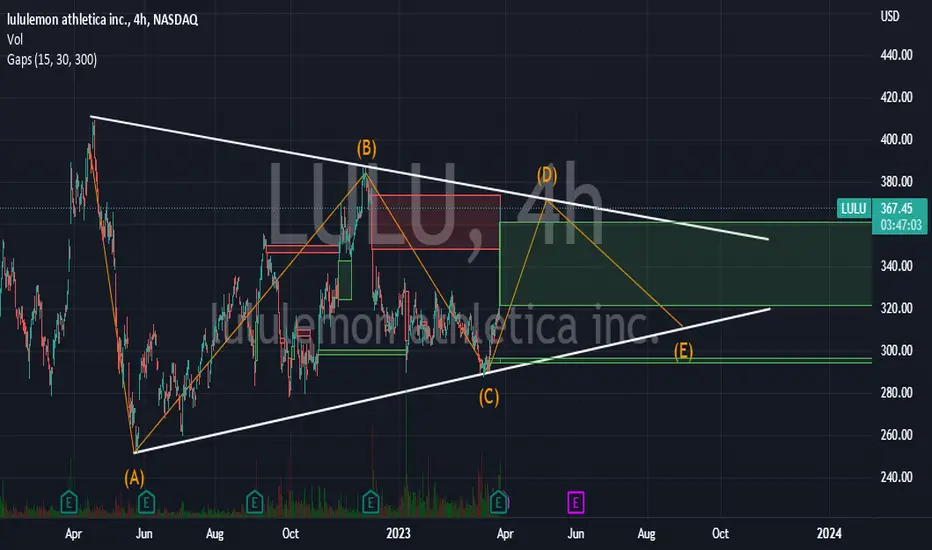
$LULU Inside triangleNot financial advice.
$LULU Be careful chasing.
Inside of a possible A,B,C,D,E, triangle Usually these triangles are forming for distribution.
Like, share and subscribe.
Thanks.
Alex!
LULU - Rounded Top Recovery A rounded top has formed on LULU
Completing this rounded top leaves price at around 190 - 200$
Following the rounded top a recovery ensues which is normally quite strong

LULU Lululemon Athletica Options Ahead Of EarningsLooking at the LULU Lululemon Athletica options chain ahead of earnings , I would buy the $310 strike price Puts with
2023-4-21 expiration date for about
$14.65 premium.
If the options turn out to be profitable Before the earnings release, I would sell at least 50%.
Looking forward to read your opinion about it.

LULU Bullish OutlookKeeping this one simple, I think Lulu is poised to retest the trendline after earnings. Resistance area around $315-$322.
Not financial advice, good luck to all :)

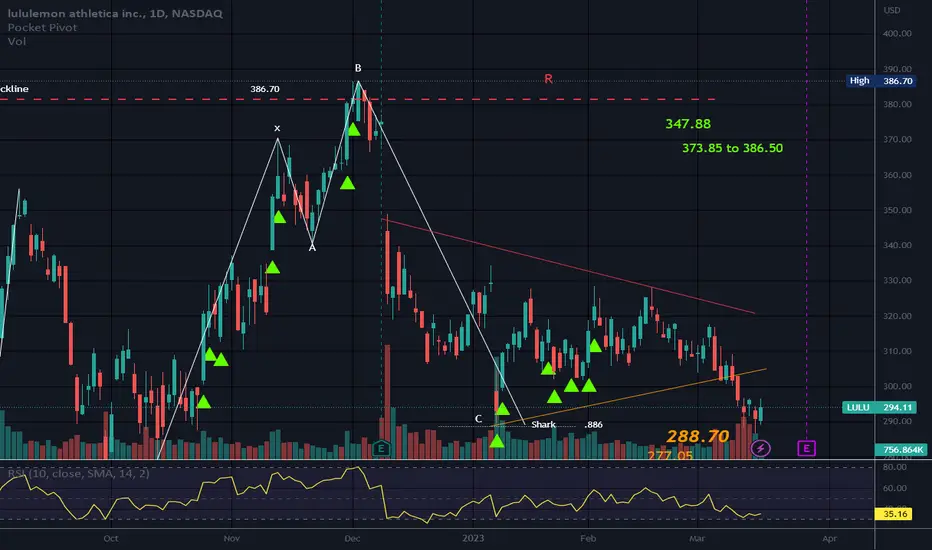
Symmetrical TrianglePrice completed an M/Shark pattern which reversed at the .886 of OX.
The shark helped positive price movement temporarily but this was bound by trendlines of the triangle.
Price is beneath the triangle now.
The Shark is labeled 0XABC.
Earnings 3-28.
No recommendation.
EPS (FWD)
9.92
PE (FWD)
29.57
Div Rate (TTM)
-
Yield (TTM)
-
Short Interest
2.52%
Market Cap
$37.39B
Bought the reboundTrading the price movement inside the big triangle. As long as there is no prolonged close below the SMA 200 (red) I'm leaning bullish here.
