Long for next 45 days . We are looking for 25% profintEntr : 24.30
1 tp : 30.30
Sl : 20.74
For fundamental we have good investing news in ai and i thing we will see a jamp as soon as possible
724 trade ideas

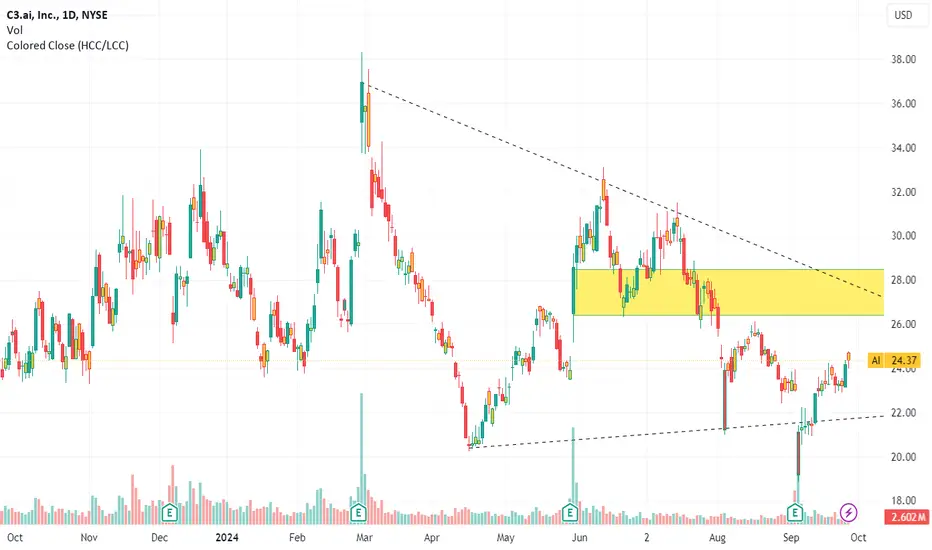
Close to the overbought area, yellow shade could be slowdownWe still see room for growth, with good fundamentals but not much catalyst other than partnerships; the lower highs and higher lows are coming to fruition. They could hit the ceiling and continue in the same format and pattern, or a breakout could be pursued. In the short term, it is bullish to the yellow box.
C3.AI is a great buy opportunity for the rest of the year.C3.ai (AI) has been trading within a Channel Down pattern for more than 1 year (since the August 01 2023 High) and yesterday it almost hit its bottom (Lower Lows trend-line). The 1D RSI breached below the 30.00 oversold barrier, and within this 1 year, it has always been a buy signal.
However we can't rule out an extended consolidation or even a slightly Lower Low within those levels until the price recovers fully, but on the long-term and particularly until the end of the year, C3.ai presents a strong buy opportunity on the current level.
The previous two Bullish Legs topped on the 0.785 Fibonacci retracement level, so our Target is 28.50 (marginally below it).
-------------------------------------------------------------------------------
** Please LIKE 👍, FOLLOW ✅, SHARE 🙌 and COMMENT ✍ if you enjoy this idea! Also share your ideas and charts in the comments section below! This is best way to keep it relevant, support us, keep the content here free and allow the idea to reach as many people as possible. **
-------------------------------------------------------------------------------
💸💸💸💸💸💸
👇 👇 👇 👇 👇 👇

Why C3.ai ($AI) Stock Is Struggling Despite Earnings Beat C3.ai (NYSE: NYSE:AI ) is facing a challenging day on the stock market after reporting its fiscal first-quarter earnings, even though it exceeded top- and bottom-line estimates. The company’s stock has plunged over 14% in Thursday’s session, reflecting investor concerns despite a strong earnings report.
Overview
C3.ai reported revenue of $87.2 million for the quarter ending July 31, representing a 20.5% increase year-over-year. This growth was driven by a 20% rise in subscription revenue, which reached $73.5 million. The company also narrowed its net loss per share to 5 cents, improving from 9 cents in the previous year. Both figures beat Wall Street’s expectations, which had forecasted revenue of $86.9 million and a net loss of 13 cents per share.
Despite these positive results, the company’s subscription revenue fell short of the anticipated $79.2 million, contributing to the stock's decline. CEO Thomas Siebel highlighted a “solid start” to the fiscal year, with C3.ai seeing continued demand for its enterprise AI solutions. However, the lower-than-expected subscription revenue overshadowed the overall positive earnings report.
Looking ahead, C3.ai provided a revenue forecast for Q2 of fiscal 2025 between $88.6 million and $93.6 million, aligning with analyst expectations. The full-year revenue guidance remains unchanged at $370 million to $395 million. However, the company also projected a larger-than-expected loss for the current quarter, further unsettling investors.
Technical Outlook
Technically, C3.ai’s stock is showing signs of strain. The shares, which had gained nearly 30% earlier this year, are now down roughly 30% since December 31. The latest price action indicates that the stock may be forming a bearish flag pattern, following a long uptrend. This pattern suggests that the current downtrend could extend further if bearish sentiment persists.
The stock’s recent drop has pushed it to its lowest levels in months, and several Wall Street analysts have revised their price targets downward. The consensus recommendation is now a "Hold," reflecting the mixed sentiment surrounding C3.ai’s performance and outlook.
Conclusion
C3.ai’s earnings report presented a mixed bag of results. While the company beat earnings estimates and continued to show growth in revenue, the underwhelming subscription revenue and higher-than-expected losses for the upcoming quarter have weighed heavily on its stock. As the company transitions to a consumption model, historically a challenging phase, investors remain cautious. The technical indicators also suggest that the stock may face further declines if the bearish trend continues. For now, investors are advised to stay alert to both fundamental updates and technical signals as C3.ai (NYSE: NYSE:AI ) navigates this turbulent period.

Adding this to watchlist given price actionAdding this to watchlist given price action, earnings and cash flow looks good, but price action post earning is really bad

Pump and dump incoming? I think this may see a pump and dump affect in the coming trading weeks just purely based on Wyckoff accumulation theory at this point.
As it's a relatively new stock, a 12 month VWAP (the biggest available anchor) shows the stock to be at the bottom end of the support.
So with that in mind + the accumulation example shown, it should fire to the upside.
Will do a little more analysis in the near future to work out how its Wyckoff patterns - and general fractals/historical data - tend to form for a more conclusive idea (see my other posts to see what I mean - they can form on slants, some phases bigger than others, etc.)
From a fundamental standpoint , it's experienced a significant decline in afterhours trading following the release of its latest earnings report.
Although the company posted revenue and earnings that exceeded expectations, its future outlook didn't meet market predictions.
The company's guidance for fiscal year 2025 was lower than anticipated, leading to doubts about its growth trajectory.
These factors, combined with broader concerns about the potential slowdown in the AI sector, prompted a rapid sell-off tonight.
If I see this pump happen, I will definitely be considering jumping on short duties for a quick midterm play.
Thoughts?

C3.AI This Golden Cross is preparing something big.It's been almost 3 months since we last looked into C3.ai (AI) where (May 10, see chart below) we called for a but that easily hit its 29.00 Target:
The price rose even higher but now finds itself considerably lower (as with the rest of the market) within the long-term Channel Down. Last month though, the stock formed its first 1D Golden Cross since February 23 2023, which may be an early indication of a bullish break-out.
That early 2023 (Jan - Apr) fractal shows that after the post-1D Golden Cross peak, the correction that was completed on the 0.5 Fibonacci retracement level gave way to a strong rebound towards the 1.5 Fib extension. As a result, our medium-term Target on this is $42.00.
-------------------------------------------------------------------------------
** Please LIKE 👍, FOLLOW ✅, SHARE 🙌 and COMMENT ✍ if you enjoy this idea! Also share your ideas and charts in the comments section below! This is best way to keep it relevant, support us, keep the content here free and allow the idea to reach as many people as possible. **
-------------------------------------------------------------------------------
💸💸💸💸💸💸
👇 👇 👇 👇 👇 👇

Hold the 25.80!! C3AiWe should hold the 25.80 level, the it should go the the price of 53. Afther that It could go to the 227 level. Just hold for now

C3ai unveils generative AI for government organizationsC3ai Inc. (NYSE: AI), a prominent developer of artificial intelligence tools, announced the launch of a generative AI application specifically tailored for government organizations on Monday. This move targets a significant growth area within the AI sector, where there is substantial interest from government entities actively investing in AI-driven tools.
The newly launched application is designed to serve federal and state governments, providing capabilities to process extensive data related to health, education, and employment programs. It offers functionalities such as answering inquiries about financial aid and managing other types of queries from millions of users, potentially transforming the efficiency and accessibility of government services.
Technical analysis of C3ai Inc. (NYSE: AI)
Let's evaluate the potential trading opportunities based on the current technical setup of C3ai's stock:
Timeframe : Daily (D1)
Current trend : The stock is currently in an uptrend
Resistance level : 30.80 USD
Support level : 29.50 USD
Potential downtrend target : Should the stock enter a downtrend, the downside target could be set at 26.00 USD
Short-term target : If the uptrend persists and the stock breaches the resistance at 30.80 USD, a short-term target could be 38.00 USD
Medium-term target : With sustained upward momentum, the stock price might rise to 48.00 USD
Investors should closely monitor C3ai's performance, especially considering the strategic expansion into the government sector with its new generative AI application. This development could significantly enhance the company's growth prospects and impact its stock performance.
—
Ideas and other content presented on this page should not be considered as guidance for trading or an investment advice. RoboMarkets bears no responsibility for trading results based on trading opinions described in these analytical reviews.
The material presented and the information contained herein is for information purposes only and in no way should be considered as the provision of investment advice for the purposes of Investment Firms Law L. 87(I)/2017 of the Republic of Cyprus or any other form of personal advice or recommendation, which relates to certain types of transactions with certain types of financial instruments.
Risk Warning: CFDs are complex instruments and come with a high risk of losing money rapidly due to leverage. 65.68% of retail investor accounts lose money when trading CFDs with this provider. You should consider whether you understand how CFDs work and whether you can afford to take the high risk of losing your money.

AI Breakout Setup 07/03/2024Love to see the volume die down while the candles continue to tighten up.. ADR at a 4.26, would love to see a momentum candle on Friday this week or Monday of next week.

AI - Long Swing Entry with close stopA long swing idea to $36 that has a very close stop loss at $26.20 - under the Friday 21 June low of day.
After the positive earnings day reaction, and the volume that came in that day, as well as the super hot AI sector blowing up right now, I think that there could be a few weeks or months ahead for this name. Again, the stop is only a single dollar away from the close.
My entry will be made on Monday the 24th of June - depending on how the stock opens on the day.

$AINot financial advice.
NYSE:AI
Scenario #1
Break white line of wedge will confirm bull side.
Scenario #2
Fail to break wedge will go for a double bottom or lower.
Like and follow for more ideas.
Thanks.

C3.ai ($AI) finishing another prolonged sideways correction?Could very well be done here already with the orange count or could provide at least another low with the yellow count.

AI: the trend now be beginningAI: the trend now be beginning
-Shakeout and backtest successfully.
-Volume exhausted at the bottom.
-Strong demand has confirmed.
.
Let's go!
More free plans at fb group: US STOCKS- WALL STREET DREAM
.
US STOCKS- WALL STREET DREAM- LET'S THE MARKET SPEAK!

C3.ai ($AI) Shares Jumped 19.44% on Strong Q4 ResultsC3.ai ( NYSE:AI ), an AI software company, is expected to see revenue growth of around 23% in fiscal year 2025, with plans to continue investing in development to establish market leadership and build a profitable enterprise software company. The company is focusing on addressing a potentially $1 trillion addressable software market, which is considered the largest market opportunity in software history.
The company's strong Q4 results and optimistic outlook highlight its position in the rapidly evolving enterprise AI market. As businesses recognize the potential of AI to transform operations, C3.ai's focus on applications and its approach to addressing challenges associated with GenAI could significantly shape the industry's future.
However, the company must navigate an increasingly competitive landscape and demonstrate the tangible benefits of its offerings to maintain its growth trajectory. The coming quarters will be crucial in determining whether C3.ai ( NYSE:AI ) can capitalize on the opportunities presented by the expanding AI market and establish itself as a long-term leader.
Technical Outlook
C3.ai ( NYSE:AI ) stock is up 19.44% trading with a Relative Strength Index (RSI) of 68.27 which is slightly overbought prior the earnings Beat. The stock is trading a little bit higher above the 200-day Moving Average (MA).

5/29/24 - $ai - careful. wrong factors into EPS.5/29/24 - vrockstar - NYSE:AI - just don't think you can buy this with confidence anywhere near current levels given 1) decelerating growth (esp looking at the 2Y stack), 2) burns cash even considering massive stock comp (which isn't cash in a declining px) and worst perhaps of all is 3) when you look at gross profit YoY difference vs. opex spending (even take out sales!) there's negative operating leverage b/c of these revenue trends.
look, idk if there's some sort of LLM pivot/ change/ integration etc. but they're going to need to retool and compete w/ a lot of biz's that are ground-up on the new models. it can def'n be done, requires the right leadership. something i'd be more keen to look into if we were in a bull market for smid tech (we're not!) - and shorting is just so miserable generally - that i'm out and probably only return once we get a clearer rates picture and i see a few more EPS pitches thrown from this one.
Careful here.


C3.AI bottomed and is going for the 1D MA50 test.C3.ai (AI) is trading within a Channel Down pattern since the August 01 2023 High and just 3 weeks ago made the 2nd Lower Low at the bottom of the pattern. If it breaks above the 1D MA50 (blue trend-line), we will have a confirmed bullish continuation for the new Bullish Leg, similar to the November 02 2023 break-out.
Until then, we expect one last short-term dip for a better buy entry, with which we will target 29.00 (just below the 0.5 Fibonacci retracement level). On the medium-term, we expect a new Lower High to be made, at least on the 0.618 Fib.
-------------------------------------------------------------------------------
** Please LIKE 👍, FOLLOW ✅, SHARE 🙌 and COMMENT ✍ if you enjoy this idea! Also share your ideas and charts in the comments section below! This is best way to keep it relevant, support us, keep the content here free and allow the idea to reach as many people as possible. **
-------------------------------------------------------------------------------
💸💸💸💸💸💸
👇 👇 👇 👇 👇 👇

C3.ai, ai - New Bottom and Timed CyclesLooking at the Timed Cycles for C3.ai I used the Timed Cycles a year ago to predict a 30% price movement and although the timing was off a bit it did hit my target. So here we are again 1 year later and based on the price movement of the stock for the previous 2 quarters I'm of the opinion that History will repeat itself. I also added in a Ghost Feed of projected candles to visualize a small run with a pullback and then subsequent move up to the next Quarterly Financials. This of course is speculative however the potential return/risk reward I am fairly confident. This is a Swing Trade that depending on your entry and exit dates can last 7 weeks. Right now in the short term C3.ai looks almost oversold and the down trend still is showing a little strength so expect overall for a neutral trend from the current price point and perhaps wait for a dip to take your position should you decide to.

Time to Long AI shareSince it has breakout from down trend. It can fly now. In long term it can break all time high too. 100% min return expected maybe 4x if all time hit. Fingers crossed!

SEIIV Studio's Sharpshooter strat (may 2024)Expect market to take a +2.1% = TP2
@ $23.35, TP1= $23.00 (+0.50%),
TP3 = +2.7% ($23.50)
Expect market to rally due to significant buys in low areas of market. expect $23.00 area to be a (repeated bouncing loop to significant incline (retest area)).

C3.ai: Channel Down bottom buy.C3.ai (AI) is bearish on the 1D technical outlook (RSI = 36.727, MACD = -1.800, ADX = 49.528) but has staged a solid recovery at the bottom of the 1 year Channel Down. This sequence is very much like the October 2023 bottom, which targeted the 0.786 Fib as a LH. Having completed a MACD Bullish Cross, we go long aiming at the top of the Channel Down (TP = 32.50).
## If you like our free content follow our profile to get more daily ideas. ##
## Comments and likes are greatly appreciated. ##

guess who's back, AI Daily timeframe analysis!🔭boost and follow for more! I'm Finally back from a long break 💙
6 month downtrend broke, resistance turned support shortly after then a higher lower!
a rally to 31.70-38.05 🎯should come soon... lets see :)
