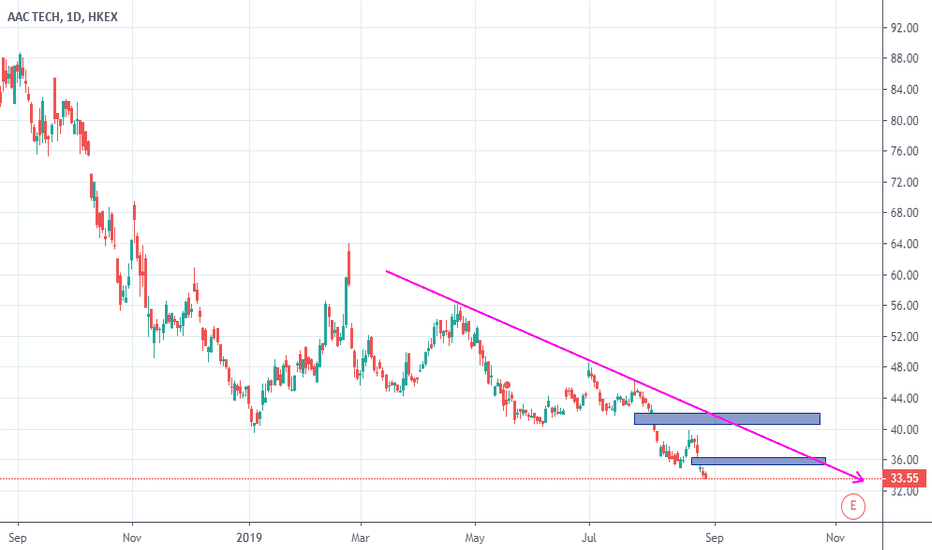
2018.HKEX_Bearish Breakdown Trade_ShortENTRY: 13.68
SL: 15.16
TP: 11.18
- ADX>25
- Daily RS -ve
- Daily FFI -ve
- Weekly RS -ve
- Weekly FFI +ve
- Moving averages are aligned.
- Stoch RSI near 70 and dipping down.
- Entry based on today breakdown from range and >3% rebound off 10EMA with volume.
- Need to watch out for earning results which is approaching
A2XN trade ideas
AAC Tech (2018 HK) [1-3 weeks view]This is an analysis for a client.
Price holding above moving average
Stochastic is testing support where price bounced in the past.
With price holding above ascending trendline support, we can expect a push up.
Please do your own due diligence.
Losses can happen so please understand your risks and investment objectives first.
AAC Technologies Holdings Inc (2018 - HK) - Impulse wave patternAAC Technologies Holdings Inc (2018 - HK) is in 2nd wave correction of C wave (or 3rd wave) down. The 5th internal wave of C wave will rise then it will start moving down. In weekly time frame it dropped in five wave impulse A wave and corrected in B wave. Now dropping in C wave, in which 3rd wave down is in progress, which should be very sharp down and big fall. In a conservative approach this may be the part of double zigzag correction. In both cases the direction will be down.
AAC Tech approaching support, potential for a bounce!
AAC Tech is expected to drop to 1st support at 45.60 where it could potentially react off and up to 1st resistance at 49.75.
Trading CFDs on margin carries high risk.
Losses can exceed the initial investment so please ensure you fully
understand the risks.
Chart of the day: HKEx: 2018 breakdown from key necklineChinese smartphone component manufacturers all started breaking down on Friday as if there were some major news in the works. Well...Google announced on Sunday it is revoking Huawei's Android license... Given sales to Huawei and Chinese smartphone manufacturers are a key source earnings and growth, this news should have a major impact on the price action.
In 2018 case, you can see Friday's price action resulted in a breakdown from a intermediate wedge pattern and an impending violation of a major neckline for the stock. Traditionally, the downside objective would be equal to the height of the top, in this case, it would imply negative value which is clearly illogical. Nevertheless, this is geopolitically driven price action, so we can only hang on for the ride (ie. if you are short) till it reaches its logical conclusion.
AACAF's Possible revival patternAACAF Had been showing promise as a growing stock but recently showed signs of decline. Over the past week or so, the stock had begun to trade under the 13EMA and showed a spurt where it began to break the 13EMA but it then fell back underneath. Over the past few days the stock began to trade sideways showing a bullish trend but today’s close (12/28/2017), was a recovery from yesterday. This might be a good place to possibly sell off shares and/or short the stock if that is what you are looking for. The MACD shows that it will continue to trade on the bearish side but in the next 2 weeks or so we might see a bounce to the bullish side. Moreover, this might be a revival period, but as far as the various indicators go, i don't recommend buying into this stock until it goes into an ascending pattern. I am a new trader and looking to learn more, so any constructive criticism is welcomed!


