$GOOGL Swing Setup - Dark Pool Liquidity WatchNASDAQ:GOOGL Swing Setup - Dark Pool Liquidity Watch
Market Bias: Neutral with bullish potential
Bullish Above: 176.00 (trigger level)
Bearish Below: 171.50 (breakdown level)
Targets Upside:
T1: 179.50
T2: 183.00
T3: 187.70
Targets Downside:
T1: 169.60
T2: 166.40
T3: 163.70
Dark Pool Levels: Watch for new prints between 172-174 for confirmation
Pattern Confirmation: Possible Cup & Handle forming above 176 breakout zone
Expected Hold: 3-5 days swing
Note: Ideal for debit spread entries with low cost options if liquidity prints on breakout
#googl #darkpool #swingtrading #optionsflow #liquidityzones #technicalanalysis #tradingplan #debitspread #volumeanalysis #institutionalorders #trader
ABEC trade ideas

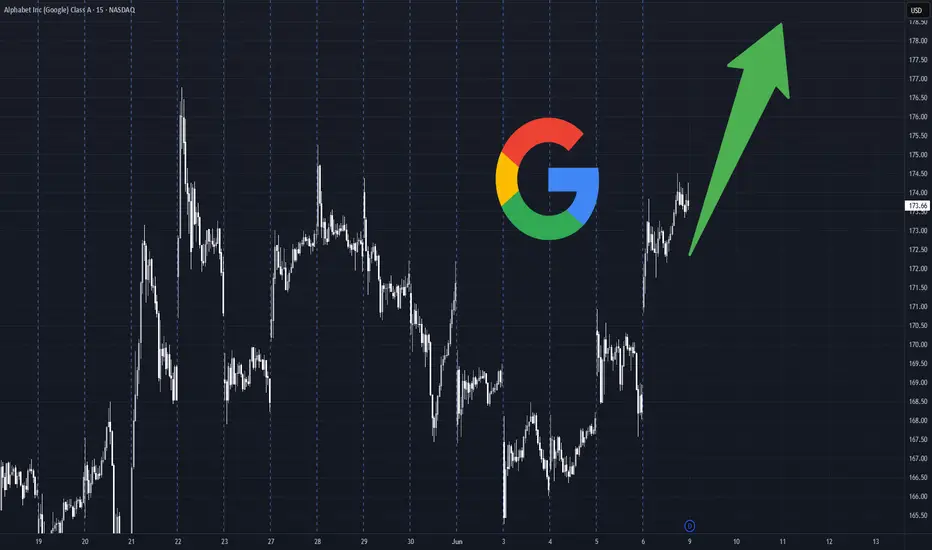
google ATH or what?google ATH or what?
optimism coming back or no? Chyna CHyna CHyna? or no CHyna? let us know~~
🐉We value full transparency. All wins and fails fully publicized, zero edit, zero delete, zero fakes.🐉
🐉Check out our socials for some nice insights.🐉
information created and published doesn't constitute investment advice!
NOT financial advice
Google (Alphabet): Overarching Downside PotentialAlphabet (GOOGL) hasn’t been able to reclaim its May 22 high and has settled into a consolidation range around the $170 level. Still, under our primary scenario, we expect the current corrective upswing to continue for a bit before turquoise wave 3 resumes the downtrend. That move should break below $138.35 and carry the price into the magenta Target Zone between $123.92 and $98. After that, a rebound within wave 4 is likely, though it probably won’t be strong enough to retake the $138.35 level. A final leg down in wave 5 should then complete the correction, driving the price deeper into the zone and establishing the low of green wave . This area also marks a potential turning point for the next major move upward. Meanwhile, a detour above resistance at $209.28 for a new high of magenta wave alt.(B) is 24% likely.
📈 Over 190 precise analyses, clear entry points, and defined Target Zones - that's what we do.

Google update According to my view you still have a chance to position yourselfs if you were scared at 161 but we are moving accordingly n following the right trend n counter pull backs normally,the only pair that still struggling in my mag 7 set up only apple but we have positive news this week n it's expected to boost the stock,soo we are going to buy apple I will forward set up aswell so do t miss Google you are still early not late 😊

GOOG | The Year of Quantum | LONGAlphabet, Inc. is a holding company, which engages in software, health care, transportation, and other technologies. It operates through the following segments: Google Services, Google Cloud, and Other Bets. The Google Services segment includes products and services, such as ads, Android, Chrome, devices, Google Maps, Google Play, Search, and YouTube. The Google Cloud segment refers to infrastructure and platform services, collaboration tools, and other services for enterprise customers. The Other Bets segment relates to the sale of healthcare-related services and internet services. The company was founded by Lawrence E. Page and Sergey Mikhaylovich Brin on October 2, 2015 and is headquartered in Mountain View, CA.

GOOGL Swing Trade Plan – 2025-06-06📈 GOOGL Swing Trade Plan – 2025-06-06
Bias: Moderately Bullish
Timeframe: 7–10 days
Catalyst: Ongoing AI sector momentum, low VIX, strong long-term trend
Trade Type: Single-leg call option
🧠 Model Summary Table
Model Direction Strike Entry Price Targets Stop Confidence
Grok Moderately Bullish $182.50 $0.92 +50% -50% 72%
Claude Moderately Bearish $170 PUT $1.95 +50–100% -30% 75%
Llama Moderately Bullish $182.50 $0.92 +50–70% -20–30% 80%
Gemini Moderately Bullish $182.50 $0.92 $1.38 / $1.84 $0.45 75%
DeepSeek Neutral (No Trade) — — — — 60%
✅ Consensus: Moderately Bullish
⚠️ Short-Term Disagreement: Claude and DeepSeek flag short-term overbought risk
📉 Technical & Sentiment Summary
Price Action: Strong bullish trend on daily/weekly; 15-min extended
RSI: Overbought on short-term, but daily RSI has room
MACD: Mixed intraday, bullish daily
Sentiment: AI hype supportive, VIX declining
Max Pain: $165 → minor resistance bias, unlikely to dominate
✅ Final Trade Setup
Parameter Value
Instrument GOOGL
Direction CALL (LONG)
Strike $182.50
Expiry 2025-06-20
Entry Price $0.92
Profit Target $1.38 (+50%)
Stop Loss $0.64 (–30%)
Size 1 contract
Entry Timing At market open
Confidence 75%
💡 Rationale: 4 of 5 models lean bullish; solid R/R from this OTM strike with tight premium.
⚠️ Risks to Watch
15-min chart overbought RSI could cause chop early next week
MACD divergence on lower timeframes may delay breakout
Max Pain at $165 could cap upside short-term if momentum fades
Time decay intensifies midweek → stick to stop or trail profits

GOOGL potential break and retestGOOGL strong break of 171.2 level, if it comes back down to retest and hold it could go up to 175.35 and would probably line up with a 9 ema test

GOOGL: Bullish Reversal Pattern Confirmed on DailyOVERVIEW:
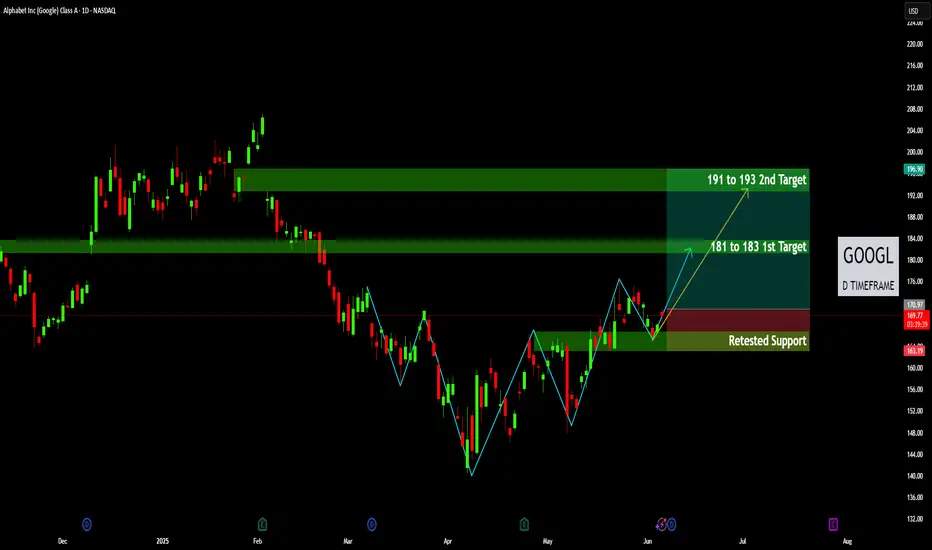
GOOGL has displayed a significant shift in its price action on the daily timeframe, transitioning from a corrective bearish phase into a confirmed bullish structure. A classic reversal pattern, followed by a successful retest of a critical level, suggests strong upside potential towards predefined resistance zones.
KEY OBSERVATIONS & MARKET STRUCTURE:
1. The Reversal - W-Formation / Double Bottom:
o Following an extended retracement from its previous highs, GOOGL formed a clear "W-Formation" or a bullish double bottom pattern. This pattern indicates that sellers lost control at the lows, and buyers stepped in to reverse the trend. The zig-zag lines highlight the swings of this reversal structure.
2. Break of Structure & Confirmation:
o The crucial element of this pattern was the break above the neckline (or intermediate resistance) of the W-formation, marked by the horizontal green zone. This breakout signaled a shift in the market structure, indicating that buying pressure was overcoming selling pressure.
o Subsequently, price has executed a textbook "Retested Support" of this breakout level (the lower green rectangle around $163.00 - $167.00). This retest, where former resistance acts as new support, is a high-probability confirmation signal for continuation of the new bullish trend. The current price action is bouncing precisely from this zone.
TRADE IDEA & POTENTIAL OUTLOOK:
Based on the confirmed bullish structure and the successful retest of support, a long opportunity presents itself:
• Entry Zone: Entries can be sought around $168.00 - $170.00, following confirmation of a bullish candle bounce from this level.
• Stop Loss (SL): A logical stop loss placement would be just below the "Retested Support" zone, specifically below the recent swing low and the lower boundary of the support area, indicated around $163.19. This placement protects capital if the bullish structure fails.
• Targets:
o 1st Target: 181 to 183 (Green Rectangle): This zone represents a prior supply area or a significant resistance level from earlier price action. It's the immediate upside objective where we might see initial profit-taking or a temporary pause.
o 2nd Target: 191 to 193 (Upper Green Rectangle): This serves as the secondary, more ambitious target. It's another historical area of price reaction, representing the next major supply zone that price could aim for if momentum carries it through the first target.
INVALIDATION:
• The bullish thesis would be invalidated if price decisively breaks and closes below the "Retested Support" zone ($163.00). A sustained break below this level would suggest that sellers have regained control, potentially leading to a deeper retracement or continuation of the previous bearish trend.
CONCLUSION:
GOOGL is showing compelling technical strength on the daily chart. The combination of a strong reversal pattern (W-formation) and a textbook retest of broken resistance, now acting as support, provides a high-probability long setup. Traders should monitor price action for a sustained move from the retested support towards the identified upside targets.
Risk Management is Paramount: Always ensure proper position sizing and adherence to your stop-loss to manage potential downside.
Disclaimer:
The information provided in this chart is for educational and informational purposes only and should not be considered as investment advice. Trading and investing involve substantial risk and are not suitable for every investor. You should carefully consider your financial situation and consult with a financial advisor before making any investment decisions. The creator of this chart does not guarantee any specific outcome or profit and is not responsible for any losses incurred as a result of using this information. Past performance is not indicative of future results. Use this information at your own risk. This chart has been created for my own improvement in Trading and Investment Analysis. Please do your own analysis before any investments.
"GOOGL Technical Play: MA Bounce for Swing Traders!"🚀 GOOGL Stock Heist: The Ultimate AI & Ad-Tech Gold Rush (Swing Trade Plan)
🌟 Market Pirates, Ready to Raid? 🏴☠️💰
🔥 Thief Trading Blueprint for GOOGL (Alphabet Inc.)
🎯 Entry (The Vault is Open!)
Pullback Breakout Strategy:
Buy Zone: Wait for a pullback near the Moving Average "Wall" (e.g., 200-day LSMA, depending on trend alignment).
Confirmation: Enter long if price bounces off the MA with volume support or breaks above a tight consolidation.
Exact Entry: $175.00 (key psychological level + MA confluence). Use buy limits for precision.
Breakout Add-On: If GOOGL clears $180 with momentum, consider adding to the position.
🛑 Stop Loss (Escape Route)
SL: Place below the recent swing low (4H/1D timeframe) or 2-3% below entry (~$170.50 if entering at $175).
Trailing SL: Adjust upward as price climbs to lock profits.
🏆 Target 🎯: $200.00 (The Ad-Tech & AI Jackpot!)
Why $200?
Cantor Fitzgerald’s bullish $200 target for NVDA reflects AI-sector optimism—similar tailwinds apply to GOOGL (AI integration in ads, cloud, and Gemini AI growth) 5.
Resistance levels and institutional liquidity zones align with this round-number target.
📈 Why GOOGL?
AI & Cloud Momentum: Google Cloud + Gemini AI adoption mirrors NVDA’s AI hype 15.
Technical Strength: Reclaimed 200-day SMA? Check for higher lows and sector leadership (like NVDA’s recent behavior) 314.
Fundamental Catalyst: Upcoming earnings or AI partnership announcements could fuel FOMO.
⚠️ Risk Management
Avoid news spikes: Earnings/regulatory news = volatility traps.
Scale out: Take partial profits at $190, let runners aim for $200.
💥 Pirate’s Bonus
Like/Boost if this plan helps! More heists incoming (TSLA? AAPL?). Stay tuned!

GOOG In Trouble!I first started warning about GOOG back on March 18, 2025
Since GOOG has formed this big bear flag outside the structure in the middle of nowhere.
This is an indication of more weakness to come!
GTF out is in order for bulls. It is better to be out of the market wishing you were in and then in the market wishing you were out!
I can only provide the setup. The rest is up to you.
Click like, follow, for more. Let's get to 5,000 followers.

Google LongsLong term trend line on Google showing has been broken during the entire market crash.
It seems to have re entered trend channel and may continue to 182.5-220 range in the short term future.
Bullish on this stock, as often the current court case with it will more than likely spark strong buyers and the price is now very cheap.
Best of luck;
Bullish on Google.

Bullish Entry at 167.5 "GOOG"After a run up from 150 to 178, GOOG has almost retraced to 0.382 Fib level. Seems like a good entry from short- and long-term perspective.

Go GOOGLE: Potential Fake Bearish H&S PatternTechnicals:
I have my own way of seeing the markets technically. Currently, on a weekly and daily chart, it appears that Google has a Bearish Head and Shoulders Pattern.
The last time that I checked, it was a fake weekly bearish Head and Shoulders Pattern.
Weekly:
This weekly bearish H&S pattern will fail! But if I am wrong, I am ready with an order at 136. It doesn't matter.
Daily chart:
Commentary:
There is a higher probability that the market for Google is set to pivot this month in June 2025 from the current 160 levels to all the way to 208.70. Google will make all-time highs above 208.70 by end of September 2025; three months from now.

$141 Stop, $207 Target — Bullish Setup on GOOGL with 1.4RMarket Context
Alphabet Inc. (GOOGL) is showing renewed bullish momentum on the 2-week chart. After a healthy correction earlier in the year, price action is now turning decisively upward, reclaiming its long-term trendline and bouncing off a major support level. This setup suggests a shift in market sentiment from consolidation to breakout mode, with significant upside potential.
Key Technical Levels
• Key Support – $151.90
This zone has acted as a major demand level and was tested multiple times. The recent bounce from here reaffirms its strength and underscores the market’s willingness to buy dips at this level.
• Stop Loss – $141.49
Positioned just below the Key Support, this stop loss accounts for volatility while protecting against a full breakdown. A close below this level would invalidate the bullish thesis.
• Resistance Level 1 (TP1) – $191.91
This price level marks a prior swing high and represents the first bullish target.
• Resistance Level 2 (TP2) – $207.32
A clear breakout beyond TP1 sets up the path toward this higher resistance, which also aligns with historical supply from mid-2021.
• Trendline Reclaim
The multi-year ascending trendline, breached temporarily, has now been reclaimed with conviction — a strong bullish signal on higher timeframes.
Trade Setup
• Entry Zone: $168.00 – $169.00
• Take Profit 1 (TP1): $191.91 (approx. 14% upside)
• Take Profit 2 (TP2): $207.32 (approx. 23% upside)
• Stop Loss: $141.49 (just below Key Support)
• Risk–Reward Ratio: Approximately 1.43
Price Action & Trend Confirmation
After establishing a series of higher lows, GOOGL has rebounded from the $151.90 zone with strength, forming a bullish engulfing candle on the 2W chart. This move brought the price back above the long-term trendline — a textbook bullish signal when viewed on a macro timescale. The structure now favors trend continuation, especially if the price holds above the $168–$170 zone in the short term.
Risk Management and Strategy
The stop loss below $151.90 is deliberately placed at $141.49 to avoid premature exit from minor volatility. This level is safely beneath the most recent swing low and gives the trade breathing room to develop. A partial exit at TP1 locks in gains while preserving capital for the extended move to TP2, where major resistance could trigger broader market attention.
Conclusion
GOOGL is setting up for a high-probability breakout from a clean technical base. With the price respecting long-term support, reclaiming the trendline, and establishing bullish momentum, the path of least resistance is upward. The trade offers a solid reward-to-risk profile and aligns with institutional-style setups often seen prior to extended rallies.
In short: GOOGL looks ready to move, and this is a setup bulls won’t want to ignore.

GOOGL Coiling Under Gamma Ceiling – Big Break or Fade Ahead?
🔍 GOOGL GEX Daily View (Options Sentiment Outlook)
Alphabet ( NASDAQ:GOOGL ) just closed around $171.14, slipping slightly from highs, and sitting in a tight wedge under major call walls at 172.5 → 175 → 180. The GEX structure shows bulls are pressing, but dealers are hedging hard into those gamma ceilings.
What GEX Tells Us:
* 🟢 Call-heavy structure above, with strong resistance at 172.5 → 175 → 180.
* 🔻 Slight GEX compression below with put wall at 162.5 and real support around 160 (–10.17% GEX zone).
* 🧊 IVR at 22.6, options are relatively cheap — perfect for low-cost directional trades.
💡 Option Trade Ideas (GEX Playbook):
* Bullish: If GOOGL breaks over 173, consider Jul 19 175c or 172.5/180 debit spread — targeting upside gamma momentum.
* Bearish: If it rejects 172.5 and loses 170, take Jul 19 167.5p or 170p/160p spread — dealers could accelerate downside below key levels.
Key Decision Zone: 170–173
Gamma resistance thick above, but IV is low enough to swing both sides with small risk.
🕵️♂️ 1H Chart Structure (Swing + Intraday Bias)
On the hourly, GOOGL broke structure briefly and swept liquidity under 167.6 BOS, then bounced hard into Friday close — forming a nice CHoCH to the upside with buyers stepping in.
Notables from the 1H chart:
* ✅ Early BOS + CHoCH combo = short-term bullish bias.
* 📦 Price sitting just below SMC supply zone at 172.5–173 — decision point here.
* 📉 Wedge forming with lower highs — needs a catalyst to pop.
📈 Swing Setup:
* Long on clean break + retest of 172.5, target 175 → 180. Stop under 170.
* Short if rejection confirms at 172.5 and we break back below 170.25, target 167.5 then 162.
📊 Intraday Plan:
* AM rejection near 172.5 = scalp short to 170.
* Bounce off 170–170.25 = scalp long into 172 area — just don’t chase middle.
Bias = cautiously bullish. This could pop if market supports, but still in a supply zone.
🧠 Final Thoughts
GOOGL is coiled just under gamma ceilings, with IV low and demand zones still holding. This is one of those setups where waiting for the breakout or clean rejection gives better RR than anticipating too early. Gamma compression means a breakout could be explosive — either direction.
⚠️ Disclaimer:
This is educational commentary only. Always do your own research and manage your risk appropriately before trading.

GOOGL JUN 2025 GOOGL Technical Analysis (May 31, 2025)
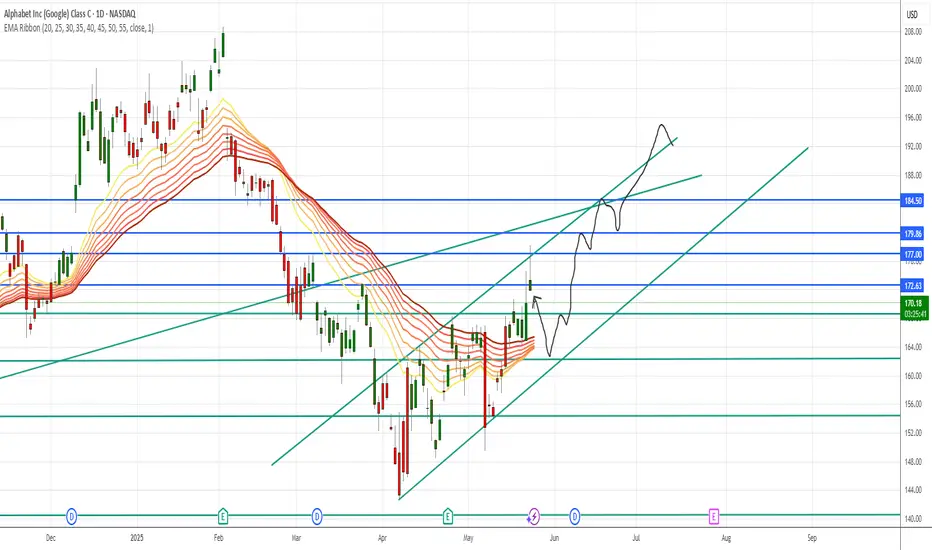
GOOGL remains in a bullish trend with key upside targets:
Main target: 185 (gap resistance)
Intermediate resistance: 180
Immediate support at 170 (distribution zone)
Critical support: 160 (stop-loss level)
If 160 breaks, next key supports are at 150, 140 (institutional buy zone 4B), and 130 (weekly support).
As long as price holds the ascending blue trendline, momentum favors the upside. A confirmed breakout above 180 could trigger a gap fill toward 200.

GOOGLE Repeating 2024 pattern and eyes $197.00Alphabet Inc. (GOOG) has established a Channel Up pattern since the (near) 1W MA200 (orange trend-line) rebound. With the 1D MA50 (blue trend-line) now acting as a Support, this pattern resembles the Channel Up formations that emerged in 2024.
Both in terms of 1W RSI and pure price action alike, we are in a similar consolidation level as November and April 2024. Both patterns peaked after similar rallies (+40.60% and +46.23% respectively), so the minimum Target we are expecting on the medium-term is $197.00.
-------------------------------------------------------------------------------
** Please LIKE 👍, FOLLOW ✅, SHARE 🙌 and COMMENT ✍ if you enjoy this idea! Also share your ideas and charts in the comments section below! This is best way to keep it relevant, support us, keep the content here free and allow the idea to reach as many people as possible. **
-------------------------------------------------------------------------------
💸💸💸💸💸💸
👇 👇 👇 👇 👇 👇

$GOOGL laggard long setupSimilar to my analysis on AAPL, I also think Google looks good for a long. I could see the possibility of a pullback down to support(s), but then that would setup a decent long up to $190+.
The structure looks like a bottom and many of the other Mag7 stocks have seen big runs, I think Google is likely a laggard and should move up to the resistances in the coming weeks.
A loss of the supports on the downside would invalidate the idea.

GOOG making moves to the upsideGOOG is back to trending up. by the time DOJ states no issues this will fly above 220
Google LongIt appears we are still in a buy phase on Google and it is ready to break above resistance, with targets of 182.50-210. This is based off the daily MACD still showing buy signal.

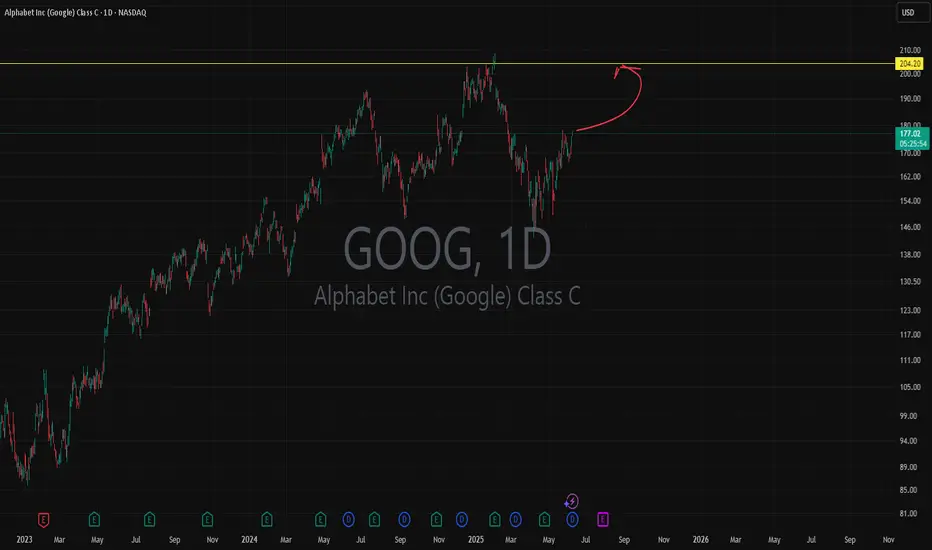
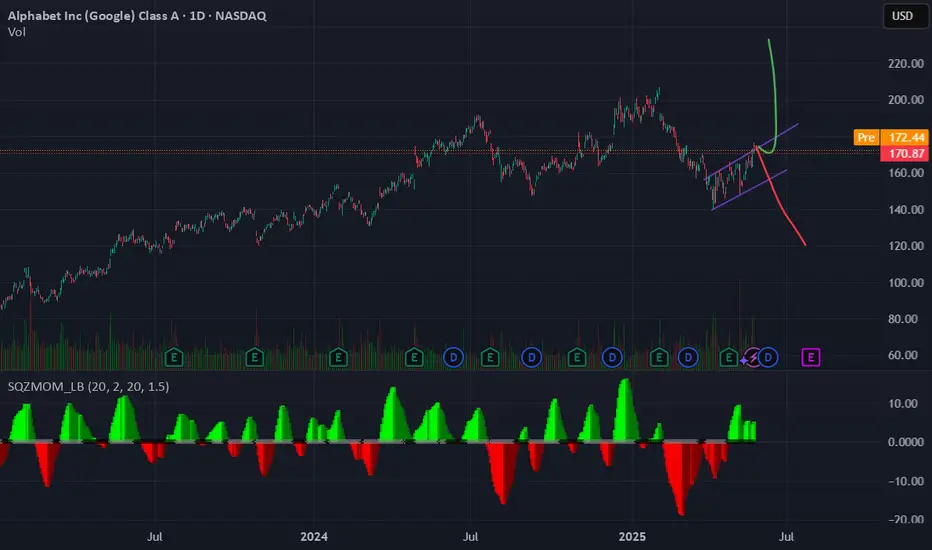
I think is green pathI know there is some bearflag as continuation in the overall tendency, but I think can try ATH again (green path) as Google is a AI gigant.
Fundamentas solid, chart is recovering nicely.
Let's see
GOOGL Long HereCouple setups to long here
Wider stop loss is safer while tighter stop loss give 1:5 risk to reward
Half % risk of trading account or less on tighter stop loss play is prudent
