$GOOG Possible Demand Zone 155-143 Targeting 178 By earning!One of worst weekly candles and 3 bearish soldiers pattern made it extremely bearish but now entered the demand zone between 155 to 143 expecting accumulation into this range then possible bottom by mid of April then moving higher after earning targeting upper gap but we keep the target more secure by targeting 178 as closing trade. 161-164 is strong resistance . so the idea bye with weakness and accumulate during coming days with stop loss below 140 approx. Earning estimate 1.6 which is a drop from 2.4 last quarter by 30% - P/E at 19.98 EPS at 8.12 - Average analyst rating at 215 (+60$) from last close at 156. these fundamental make this idea is much likely to succeed. Good luck - please like and share . thanks
ABEC trade ideas

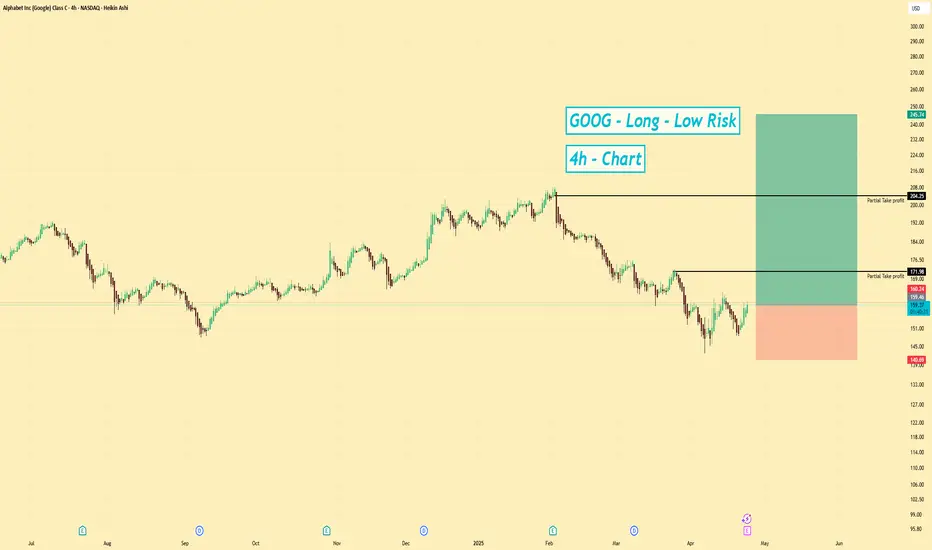
GOOGL | Long | Strong Fundamentals | (April 2025)GOOGL | Long | Strong Fundamentals + Technical Support | (April 2025)
1️⃣ Insight Summary:
Google (GOOGL) is showing strong fundamental performance with healthy earnings, a growing outlook, and a technically supportive zone. It’s currently sitting at $159, and based on both macro trends and chart structure, there’s potential for a move higher.
2️⃣ Trade Parameters:
Bias: Long
Entry: Around $159
Stop Loss: $140
TP1: $160 ✅ (light partial)
TP2: $200 ✅ (major target)
Ultimate Target: $250 🏁
Partial Exits: 25% at each target level to manage risk and lock in gains.
3️⃣ Key Notes:
🔹 Fundamentals are solid: Google has a net income of $100B and EPS around $8, with a growing outlook.
🔹 Dividend yield is modest at 0.51%, but it's backed by $28B in debt and strong cash flow.
🔹 Technically, GOOGL is trading in a supportive zone and could revisit previous highs around $200+.
🔹 Market cap sits at $2T, showing investor confidence.
🔹 Watch the broader market (e.g., SPX, NQ) for sentiment shifts that could impact tech stocks.
4️⃣ Follow-up:
Will review this trade setup and update if price approaches $200 or reacts at key levels.
Please LIKE 👍, FOLLOW ✅, SHARE 🙌 and COMMENT ✍ if you enjoy this idea! Also share your ideas and charts in the comments section below! This is best way to keep it relevant, support us, keep the content here free and allow the idea to reach as many people as possible.
Disclaimer: This is not a financial advise. Always conduct your own research. This content may include enhancements made using AI.
$GOOGL primed for a BIG MOVE!NASDAQ:GOOGL primed for a BIG MOVE! 🚀
Heading into earnings, this stock’s valuation has been overlooked—but strong results could flip the narrative fast! 💨
✅ Bounced off 2021 highs
✅ RSI at its lowest since COVID
✅ Major indicators curling upward
✅ Volume shelf launch incoming
✅ Wr% pendulum swinging
Momentum is building—are you ready? 👀
Not financial advice

Google - Last earnings call before tariffs affect revenue?Hi guys please find below the analysis we did for Google (ALPHABET)
Alphabet Inc. (NASDAQ: GOOG) is poised to deliver a robust Q1 2025 earnings report, with analysts projecting revenue of $89.22 billion—an 11% year-over-year increase—and net income of $24.71 billion ($2.01 per share), up from $23.66 billion ($1.89 per share) a year ago . This anticipated growth is largely driven by Alphabet's strategic investments in artificial intelligence (AI) and cloud computing, which have bolstered its core businesses, including Google Search and YouTube .
Resilience Amid Tariff Concerns
While recent U.S. tariffs have disrupted global supply chains, particularly affecting hardware-dependent sectors, Alphabet's business model is predominantly digital and service-oriented. Its primary revenue streams—digital advertising, cloud services, and AI-driven platforms—are less susceptible to such trade tensions. Analysts from Citi and Morgan Stanley have expressed confidence in Alphabet's ability to navigate macroeconomic challenges, citing the company's AI-driven innovations as key growth drivers.
General analyst Confidence and Stock Performance
Despite a 20% decline in Alphabet's stock value earlier in 2025, the company's strong fundamentals have led to bullish sentiments among analysts. Price targets have been set as high as $195, suggesting a potential upside of up to 29% from recent levels . The company's continued focus on AI and cloud services positions it well for sustained growth, even amidst global economic uncertainties. In summary, Alphabet's upcoming earnings call is expected to highlight the company's robust performance and resilience, underscoring its ability to thrive despite external economic pressures.
📌 Trade Plan
📈 Entry: 155.41
✅ Target: 181.30
❌ SL: 121
We are looking for +-20% increase in the upcoming days/weeks!

GOOGL Daily Tarde SetupIn this update we review the recent price action and earnings expectations for Alphabet and identify the next high-probability trading opportunities and price objectives to target. To review today's video analysis, click here!

GOOGL: A Resilient Bounce Sets Up the Next WaveGOOGL DAILY TECHNICAL ANALYSIS 📊
OVERALL TREND
📈 UPTREND — Price has rebounded off the April low with increasing bullish pressure, now holding above key short-term moving averages. A potential trend reversal is underway if momentum sustains above 155.
📉RESISTANCE ZONE
🔴 207.05 — PIVOT HIGH | SELL STOPLOSS
🔴 203.76 — SELL ORDER II
🔴 197.10 — SELL ORDER I
🎯ENTRIES & TARGETS
🟢 193.74 — EXIT BUY & TP 4
🟢 181.64 — BUY ORDER & TP 3
🟢 173.79 — BUY ORDER & TP 2
🟢 140.53 — BUY ORDER & TP 1
📈SUPPORT ZONES
🟢 150.92 — BUY ORDER 1
🟢 143.85 — BUY ORDER 2
🟢 207.05 — BUY STOPLOSS | PIVOT LOW
📈MOVING AVERAGE SUMMARY
✅ Short-Term MAs (10–50) — Bullish crossover confirmed, supporting upside
⚠️ Mid-Term MAs (100) — Still bearish, price must sustain above 156.70
🔴 Long-Term MAs (200) — Bearish, still weighing on broader structure
✍️STRUCTURAL NOTES
Price recently flipped bullish across 10–50 SMA/EMA clusters
Volume confirming strength, but needs follow-through above 162.48
Stochastic RSI (95.93) is overheated — expect short-term pullback or consolidation
MACD, Momentum, and AO all signal increasing buy-side control
Ichimoku Base Line (153.25) being tested — reclaiming it is bullish confirmation
TRADE OUTLOOK 🔎
📈 Bullish bias holds above 150.92 and especially above 155.63
🎯 Upside targets: 162.48 → 173.79 → 181.64
📉 Short-term rejection possible near TP1 — RSI and StochRSI nearing exhaustion
👀 Watch for a decisive break above 162.48 with volume for continuation
🧪STRATEGY RECOMMENDATION
CONSERVATIVE (Trend-Following):
— Buy Entry: 155.63
— TP Levels: 162.48 / 173.79 / 181.64
— SL: Below 150.92
HIGH-RISK SCALP (Momentum Pullback):
— Buy Dip: 150.92 or 143.85
— TP: 155.63 / 162.48
— SL: Below 140.35
“Discipline | Consistency | PAY-tience”

GOOGL - Melt up & Crash series [5 - Final]Not financial advice.
I believe this is it.
Not financial advice

Alphabet (GOOGL) Shares Hover Near Psychological LevelAlphabet (GOOGL) Shares Hover Near Psychological Level Ahead of Earnings Report
On 31 March, we noted that bearish sentiment could push Alphabet’s (GOOGL) share price towards the psychological level of $150. As the current price chart suggests, GOOGL is now trading close to that very level.
Moreover, the price is approximately equidistant from the recent highs and lows (marked A and B), which may be interpreted as a sign of balanced supply and demand — and a wait-and-see stance from market participants ahead of Alphabet’s Q1 earnings release (scheduled for tomorrow, 24 April).
Awaiting the GOOGL Earnings Report
With the Nasdaq 100 index (US Tech 100 mini on FXOpen) having fallen by around 13.5% since the beginning of the year, investors are approaching tech earnings with caution. According to Barron’s, three key themes are expected to dominate the narrative:
→ management forecasts amid continued uncertainty around the White House’s tariff policy;
→ plans for major capital investment in AI-related infrastructure;
→ signs of softening consumer demand.
Given the current climate of uncertainty, Alphabet’s earnings report could prove particularly influential — serving as a benchmark for shaping market expectations ahead of other major tech company reports.
Technical Analysis of Alphabet (GOOGL)
The $150 level has served as key support throughout 2024, and over the coming days it may act as a springboard for a new price movement, potentially driven by the earnings results.
From a bearish perspective, the market remains in a downward trend (indicated in red) following a breakout below the lower boundary of a previously active rising channel (marked in purple) that had held since last autumn. However, if Alphabet’s management maintains an upbeat outlook for 2025, this could give the bulls the confidence to challenge the upper limit of the red channel.
This article represents the opinion of the Companies operating under the FXOpen brand only. It is not to be construed as an offer, solicitation, or recommendation with respect to products and services provided by the Companies operating under the FXOpen brand, nor is it to be considered financial advice.

GOOGL Coiling for a Breakout? Gamma Walls Say 160+ in Sight 🔍 GEX & Options Flow Insights
GOOGL is setting up for a potential gamma squeeze. The current price is inching just below a critical gamma transition zone between 155–160, where we see:
* High GEX levels stacked at 159.5 and 162.5 (73% and 70% respectively)
* Call Wall alignment across 159–165 levels — dealers may be forced to buy to hedge if we break 155
* HVL (High Volume Level) sits at 148 — marking key put support and invalidation
IVR is 60.5, which shows there’s still premium left to be sold — but it’s not overpriced. That’s a great environment for directional call spreads with gamma flow support.
💡 My Options Strategy Idea (Bullish Bias):
* Play: Bull Call Spread – Buy 155c / Sell 160c
* Rationale:
1. Risk is capped and affordable
2. Profit range aligns perfectly with GEX targets
3. The spread benefits if dealers fuel a move toward gamma wall pressure zones
The GEX landscape suggests upward dealer flows, not resistance, as long as we stay above 152.5–155.
📊 Smart Money Technical View
From a price action perspective, GOOGL has flipped bullish after reclaiming the CHoCH zone. We’re hovering just beneath the key breakout level.
* Trend Bias: Strong Bullish on 30m and 1h
* Volume Note: Very thin (0.04x) — price is rising, but it needs conviction candles soon
* Structure: Bullish CHoCH formed → BOS confirmed → Setup forming
* Target 1: 159.54 (aligned with GEX #1 wall)
* Target 2: 164.31 (near GEX #2 zone)
* Stop: 150 (under structure + below HVL)
🎯 What I’m Watching for Trade Confirmation:
* Hold above 152.5 = bullish continuation
* Break and close above 155 with volume = BOS confirmed → RUNNER potential
* Fade or stall below 151 = caution — wait for re-entry
🧠 My Thoughts & Why This Setup Matters
This is one of those setups where both the options market and smart money price structure are talking the same language — bullish, but not impulsive yet.
What makes it powerful is the layered confluence:
* Dealer gamma exposure creates a pull toward 159.5–162.5
* The technicals show a textbook CHoCH and BOS pattern
* The entry risk is defined, the structure is clean, and volume is the only missing ingredient
If we get confirmation through volume and momentum, GOOGL could become a high R/R long into the end of the week, especially if the market holds up.
📌 Final Summary:
* Direction: Bullish Bias
* Options Strategy: 155c/160c Call Spread targeting 159.5–162.5
* Entry Trigger: BOS above 155 with volume
* Risk Zone: Below 151–150 (HVL + SL)
Let price and flow confirm. This one could rip with the right spark.
⚠️ Disclaimer
This analysis is for educational purposes only and not financial advice. Always do your own due diligence. Manage risk and never trade based solely on external suggestions.

GOOG Alphabet Options Ahead of EarningsIf you haven`t bought GOOG before the previous rally:
Now analyzing the options chain and the chart patterns of GOOG Alphabet prior to the earnings report this week,
I would consider purchasing the 170usd strike price Calls with
an expiration date of 2025-7-18,
for a premium of approximately $4.35.
If these options prove to be profitable prior to the earnings release, I would sell at least half of them.

GOOGL 1H Swing Long Conservative Trend TradeConservative Trend Trade
+ long impulse
+ 1H / 1D level coincide
+ T2 level
+ support level
+ biggest volume 2Sp-
Calculated stop limit
1 to 2 R/R take profit
Daily Trend
"+ long impulse
+ JOC test / T2 level
+ support level
+ 1/2 correction"
Monthly Trend
"+ long impulse
+ T2 level
+ support level
- before 1/2 correction"
Yearly Trend
"+ long impulse
- T1 level
- resistance level"

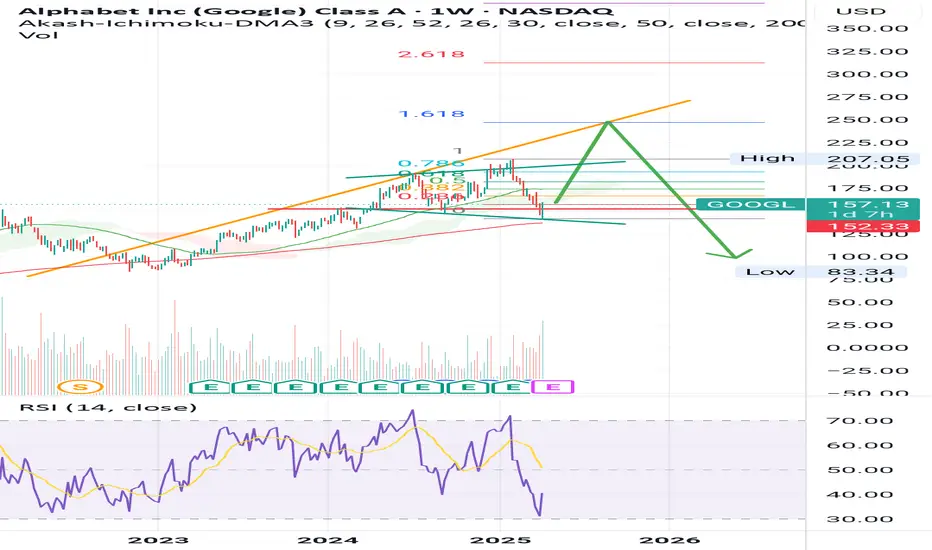
Google's Q1 Earnings:Tariff Shock and Tech SlowdownAlphabet's stock is down 26% since December 2024. With a fragile technical setup and mounting macroeconomic headwinds, Q1 results may confirm investors' worst fears.
Market Position: From Leadership to Uncertainty
Alphabet Inc. (GOOG) is set to report its Q1 earnings and revenue on Thursday, April 24, 2025, in what could be a decisive moment for the stock. After eight consecutive quarters of beating both EPS and revenue estimates, cracks have finally begun to emerge. Since posting a modest surprise in Q4 2024—only $0.031 above EPS expectations and a rare $230 million revenue miss—GOOG's stock has fallen over 26%, plunging from its December 2024 high of $208.70 to a pre-Easter close of $153.36.
The technical rejection at the 10-month supply zone between $163 and $169, followed by a short-lived bounce off $143, signals ongoing bearish momentum. Alphabet is now testing a crucial 8-month support band between $154 and $149, with $143 as the next downside line of defence. A break below could expose the stock to $140 and potentially $134.
Fundamental Headwinds: Tariffs, AI Spending Cuts, and Margin Pressure
While GOOG's fundamentals have held up in previous quarters, the macroeconomic backdrop is deteriorating rapidly:
U.S.–China Tech Tariff War: Alphabet is among the U.S. tech giants most exposed to China's retaliatory tariffs. Although Alphabet has limited direct hardware exposure compared to Apple, its ad revenue, cloud services, and Android device licensing in China and APAC could face indirect blows. Chinese firms may opt to reduce dependence on U.S. platforms amid rising regulatory barriers.
AI Investment Oversaturation: Alphabet's aggressive AI expansion—particularly in training large language models and server infrastructure—has led to ballooning capital expenditures, reportedly over $40 billion in 2024 alone. Analysts now question whether this spending is delivering sufficient monetization. With global economic growth slowing, Alphabet could face challenges converting AI hype into meaningful revenue gains in 2025.
Digital Ad Market Maturity: Advertising growth, the backbone of Alphabet's earnings, is showing signs of plateauing, especially in the U.S. and Europe. Major advertisers are cutting budgets, with global marketing spending expected to decelerate to 2.1% YoY growth in 2025, the slowest pace since the pandemic recovery in 2021.
Margin Compression Risk: Labor costs, data centre energy prices, and regulatory compliance have all contributed to margin compression, which is a key reason behind the modest EPS surprise in Q4 2024.
Technical Outlook: Make-or-Break Levels into Earnings
From a price structure standpoint, Alphabet remains within a well-defined 5-month descending channel. The failed breakout at $163–169 reinforced the bearish setup. At present:
Support to watch:
$154: Key mid-channel level. A break likely triggers a retest of $149.
$143: A line in the sand—a break below opens the path to $140 and $134.
Resistance to clear:
$160: First barrier to regain upside momentum.
$163–169: Must be reclaimed to reverse the medium-term bearish trend.
If Q1 results disappoint or forward guidance is downgraded, this structure could rapidly break down. Conversely, a strong report that beats the estimated EPS of $2.008 and revenue consensus of $89.23B may spark a short-term relief rally, especially if AI monetization or YouTube ad revenue surprises to the upside.
Looking Back: Earnings Consistency—But Cracks Forming
Past 8 Quarters – EPS Performance:
Largest upside surprise: March 2024 (25.09%)
Weakest: December 2024 (1.45%)
Past 8 Quarters – Revenue Performance:
Largest beat: September 2024 ($1.88B)
First miss in 2 years: December 2024 (–$230M)
This signals a trend reversal that may now accelerate under economic pressure.
Investor Takeaway: Don't Ignore the Macro Shift
Alphabet's Q1 report is more than a corporate update—it's a benchmark for Big Tech's resilience under mounting global stress. With equity markets increasingly sensitive to tariffs, yield curve dynamics, and rising economic fragmentation, Alphabet's results could reverberate across the Nasdaq and broader tech complex.

GOOGL Weekly Options Trade Plan 2025-04-17GOOGL Weekly Analysis Summary (2025-04-17)
Below is our integrated analysis for GOOGL weekly options trading based on the current options data and the multiple model reports:
──────────────────────────────
Comprehensive Summary of Each Model’s Key Points
• Grok/xAI Report – Observes that although the 5‐minute chart shows a hint of short‐term bullishness, the daily chart is clearly bearish (price below the 10 EMA and RSI around 41) and news catalysts (antitrust concerns) add further downside bias. – Highlights a significant concentration of put open interest around the $150 strike and recommends buying the $150 put at a premium of about $0.24 with an entry at open. – Suggested profit target at roughly a 50% premium increase and a stop loss if the premium falls by about 25% (or if the price fails to break key resistance).
• Claude/Anthropic Report – Confirms a moderately bearish bias with price trading below all key daily EMAs and negative regulatory news intensifying the downside. – Points to the heavy open interest in the 150 puts and emphasizes that although max pain is at $155 (a theoretical pull toward higher prices), the aggressive negative catalyst trumps this signal. – Recommends a put trade with guidelines for profit-taking (roughly a 100% premium gain) and a 50% premium stop-loss; entry to be made at market open.
• Gemini/Google Report – Notes the strong bearish daily setup (price clearly below the 10/50/200 averages and near key supports around $150) combined with negative antitrust headlines. – While acknowledging some short-term consolidation on the 5-minute chart, the report favors a bearish play and selects the $150 put (even though its premium of $0.24 is a bit below the “ideal” $0.30–$0.60 range). – Recommends entering at open with specific targets (aiming for around a 100% return on premium or an exit if the underlying fails to break levels) and strict stop-loss discipline.
• Llama/Meta Report – Summarizes that the technicals (including MACD and RSI on both timeframes) and high volatility (VIX ~32.64) combine for a moderately bearish setup. – The heavy put open interest at $150 further reinforces this view. – Recommends buying the $150 put at market open with a modest profit target (around a 50% gain on premium) and a stop-loss if the underlying rallies above key resistance levels.
• DeepSeek Report – Emphasizes that despite the max pain at $155, the technical breakdown below key moving averages and significant negative news support a bearish trade. – Recommends buying weekly (0DTE) $150 puts at the current premium of $0.24, with exit parameters tied to breaching immediate support or achieving a 50% gain in premium. – Notes that risk management is crucial given the 0DTE nature and high volatility.
────────────────────────────── 2. Areas of Agreement and Disagreement Between Models
• Agreement: – All models share a moderately bearish outlook driven by a combination of: ○ Price performance below key moving averages and declining daily RSI. ○ Negative news catalysts (antitrust issues and breakup concerns). ○ Heavy put open interest at the $150 strike, aligning with technical support. – Each model favors a single-leg, naked put strategy on GOOGL weekly expirations, with an entry at market open.
• Disagreement: – There is some variation in the selection of profit target and stop loss levels: ○ Grok/xAI and DeepSeek lean toward a profit target near a 50% premium gain and a tighter stop loss, while Claude/Anthropic and Gemini reference a slightly larger profit target (up to 100% gain) paired with a 50% stop loss. – There is a mild conflict with the max pain theory (which is bullish at $155) versus the consensus technical and news story indicating further downside. However, all models agree that the negative catalysts outweigh the theoretical pull toward max pain.
────────────────────────────── 3. Conclusion and Trade Recommendation
• Overall Market Direction Consensus: – The integrated view is moderately bearish. Although intraday charts hint at short-term consolidation, the dominant daily technicals, high volatility, and strongly negative news set the stage for further downside pressure.
• Recommended Trade: – We recommend buying a single-leg, naked put option. – Selected Instrument: GOOGL weekly option with a $150 strike (0DTE expiring on 2025-04-17). – Premium: The current ask is $0.24 per contract. Although this is slightly below the ideal range, the risk/reward profile is favorable given the strong technical and sentiment bias. – Entry Timing: Enter at market open. – Profit Target: Aim for a premium increase to approximately $0.36 (a ~50% gain). – Stop-Loss: Set a stop-loss around $0.12 (roughly a 50% reduction in premium), or exit if the underlying rallies decisively above the intraday resistance levels (around $152). – Confidence Level in the Recommendation: Approximately 70%.
• Key Risks and Considerations: – The max pain level at $155 could introduce some intraday upward pressure. – High implied volatility (VIX at 32.64) means rapid moves could quickly hit stop-loss triggers. – The 0DTE nature of the option calls for strict monitoring; if GOOGL fails to break below key support levels early on, exit the position promptly. – Overall market reversals or unexpected news can rapidly change the trade dynamics.
────────────────────────────── 4. TRADE_DETAILS (JSON Format)
{ "instrument": "GOOGL", "direction": "put", "strike": 150.00, "expiry": "2025-04-17", "confidence": 0.70, "profit_target": 0.36, "stop_loss": 0.12, "size": 1, "entry_price": 0.24, "entry_timing": "open" }
Disclaimer: This newsletter is not trading or investment advice but for general informational purposes only. This newsletter represents my personal opinions based on proprietary research which I am sharing publicly as my personal blog. Futures, stocks, and options trading of any kind involves a lot of risk. No guarantee of any profit whatsoever is made. In fact, you may lose everything you have. So be very careful. I guarantee no profit whatsoever, You assume the entire cost and risk of any trading or investing activities you choose to undertake. You are solely responsible for making your own investment decisions. Owners/authors of this newsletter, its representatives, its principals, its moderators, and its members, are NOT registered as securities broker-dealers or investment advisors either with the U.S. Securities and Exchange Commission, CFTC, or with any other securities/regulatory authority. Consult with a registered investment advisor, broker-dealer, and/or financial advisor. By reading and using this newsletter or any of my publications, you are agreeing to these terms. Any screenshots used here are courtesy of TradingView. I am just an end user with no affiliations with them. Information and quotes shared in this blog can be 100% wrong. Markets are risky and can go to 0 at any time. Furthermore, you will not share or copy any content in this blog as it is the authors' IP. By reading this blog, you accept these terms of conditions and acknowledge I am sharing this blog as my personal trading journal, nothing more.

GOOGL GEX Alert: Sitting on a Gamma Cliff! 🔮 GEX (Gamma Exposure) – Options Sentiment Analysis
🚨 Key PUT Pressure Zone at 155–152.5
* GOOGL is currently hovering above its highest negative GEX level at 155.14, which aligns with a thick PUT support wall.
* A breakdown below 155 could trigger gamma-induced acceleration to 152.5, then quickly toward 150, where another major PUT wall sits.
🧱 Resistance Cluster Overhead at 157.5–162.5
* GEX shows a dense band of CALL resistance forming between 157.5 and 162.5, topped off by another CALL wall around 165.
* Dealers will likely hedge downward moves aggressively below 155, while upside attempts could struggle to break through the 160–162 band unless sentiment flips.
💡 Options Data Summary:
* IVR: 54.6 → Elevated implied volatility rank, indicating heightened option premiums.
* IVx: 46.6 with a –10.67% drop, suggesting traders are de-risking or volatility is being absorbed.
* PUTS make up 15.8%, which is moderate but growing — enough to trigger strong downside gamma flows if breakdown happens.
🎯 GEX Scenario Outlook:
* Bearish Trigger: A flush under 155 likely unlocks 152 → 150 → 145 range targets fast.
* Bullish Reversal: Needs to reclaim 157.5, then challenge the 160–162.5 zone, where CALL hedging could stall any rally.
🕰️ Technical Analysis – 1H Chart Summary
Trend Weakening:
* GOOGL is breaking down from a rising wedge and has lost VWAP and short EMAs.
* Selling volume is increasing while momentum fades — confirming short-term bearish bias.
MACD:
* Bearish crossover confirmed, histogram widening on the downside.
RSI:
* Sliding under 40, no sign of bullish divergence — momentum supports further downside.
Key Technical Zones:
* Support: 155.14 (GEX support), 152, 149.96, 141.78
* Resistance: 157.5, 160, 162.31
🧠 Final Thoughts:
GOOGL is resting on critical GEX PUT support at 155 — a break here could act like a trapdoor to 150 or even sub-145 levels. On the other hand, bulls must break through layered CALL walls up to 162.5 to regain any control.
With IV cooling, GEX dominant to the downside, and technicals aligning, caution is key. Wait for confirmation — this is a gamma-driven battleground.
This analysis is for educational purposes only and does not constitute financial advice. Always do your own research and manage risk accordingly.

Google bounces from supportGoogle bounced from a support level and is currently above ema. If it can sustain above the ema for April close, it can be a positive sign for google. Not a trading advice, just sharing my analysis.

Google - Fantastic Bullish Break And Retest!Google ( NASDAQ:GOOGL ) just looks amazing:
Click chart above to see the detailed analysis👆🏻
For more than a decade, Google has been trading in a rising channel formation, perfectly respecting all market structure. Now, Google is about to retest the previous all time high once again and with a sharp correction of about -25%, this offers a significant bullish reversal setup.
Levels to watch: $150
Keep your long term vision,
Philip (BasicTrading)

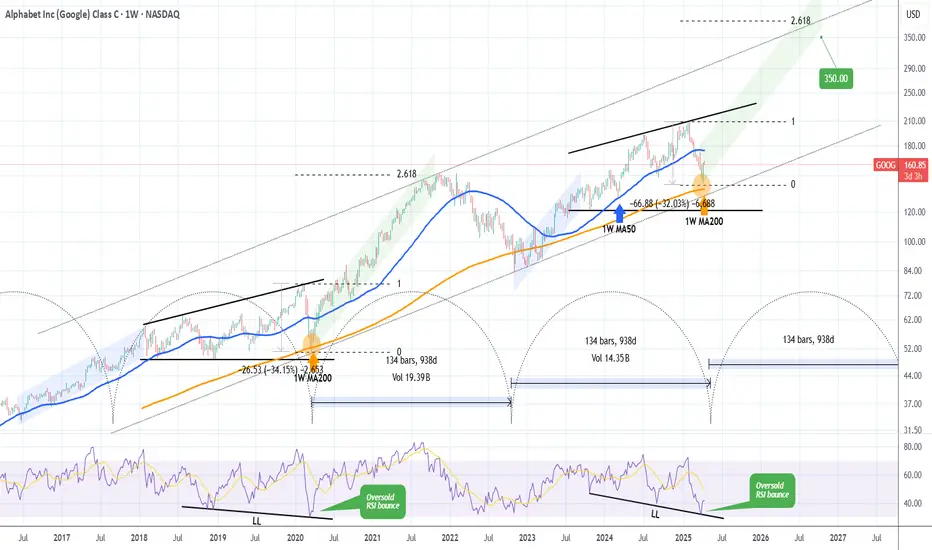
GOOGLE's generational bottom made. This is how it reaches $350.Alphabet Inc. (GOOG) almost tested last week its 1W MA200 (orange trend-line). That level has been holding for more than 2 years (since March 13 2023) and it's been the main Support of the Bull Cycle that followed the November 2022 Inflation Crisis bottom.
The pattern is almost like the Ascending Triangle that led to the March 2020 COVID crash, which was the most recent time before the late 2022 bottom that the stock made contact with the 1W MA200. As you realize, all those times have been what we call 'generational bottoms', thus extremely good long-term buy opportunities. And as you see they've been on extremely tight time symmetry, all took place roughly every 2.5 years.
If the pattern continues to repeat itself, then we may witness a rally (green Channel Up) similar to the one that peaked on November 2021 and reached the 2.618 Fibonacci extension. As a result, setting a $350 Target would be more than realistic based on this pattern.
-------------------------------------------------------------------------------
** Please LIKE 👍, FOLLOW ✅, SHARE 🙌 and COMMENT ✍ if you enjoy this idea! Also share your ideas and charts in the comments section below! This is best way to keep it relevant, support us, keep the content here free and allow the idea to reach as many people as possible. **
-------------------------------------------------------------------------------
💸💸💸💸💸💸
👇 👇 👇 👇 👇 👇
Pop and Flop in GOOGL?Google recently staged a sharp rebound, filling the gap perfectly after a major sell-off driven by tariff-related headlines. While I had personally expected a deeper move into the $137.36–$135.41 range, price found strong buying interest earlier than anticipated.
The area we bounced from is significant—it's essentially the origin of the move that led to Google’s all-time high in 2024. However, despite the bounce, GOOGL has lost support across all timeframes , which shifts my focus toward potential short opportunities.
I’m now watching for a reaction around the support-turned-resistance zone near $164 . There’s an untested monthly level at $161.72 , which could trigger a reaction, but the area I’m really eyeing is the weekly resistance zone from $164 to $165.87 . I believe this range could act as a strong reversal zone and spark a deeper pullback.
If that rejection plays out, here are the levels I’m watching for downside targets:
- Target 1: $157.04 (daily support zone)
- Target 2: $146.75 (leg end and major weekly swing low from September 2024)
- Target 3: $141.55 (previous leg low)
- Final Target: New lows below $140.00
This short setup was far more appealing before the recent bounce off the $140 zone, so I will remain cautious. However, if price starts reacting from this resistance zone and breaks back below the monthly at $161.72 —or even more convincingly, the local daily support at $160.67 —that would trigger confirmation for continuation to the downside.
Invalidation levels:
- A weekly close above $165.03
- A daily close above $170.60
Either of those would invalidate the short thesis.

Can Efficiency Topple AI's Titans?Google has strategically entered the next phase of the AI hardware competition with Ironwood, its seventh-generation Tensor Processing Unit (TPU). Moving beyond general-purpose AI acceleration, Google specifically engineered Ironwood for inference – the critical task of running trained AI models at scale. This deliberate focus signals a Major bet on the "age of inference," where the cost and efficiency of deploying AI, rather than just training it, become dominant factors for enterprise adoption and profitability, positioning Google directly against incumbents NVIDIA and Intel.
Ironwood delivers substantial advancements in both raw computing power and, critically, energy efficiency. Its most potent competitive feature may be its enhanced performance-per-watt, boasting impressive teraflops and significantly increased memory bandwidth compared to its predecessor. Google claims nearly double the efficiency of its previous generation, addressing the crucial operational challenges of power consumption and cost in large-scale AI deployments. This efficiency drive, coupled with Google's decade-long vertical integration in designing its TPUs, creates a tightly optimized hardware-software stack potentially offering significant advantages in total cost of ownership.
By concentrating on inference efficiency and leveraging its integrated ecosystem, encompassing networking, storage, and software like the Pathways runtime, Google aims to carve out a significant share of the AI accelerator market. Ironwood is presented not merely as a chip, but as the engine for Google's advanced models like Gemini and the foundation for a future of complex, multi-agent AI systems. This comprehensive strategy directly challenges the established dominance of NVIDIA and the growing AI aspirations of Intel, suggesting the battle for AI infrastructure leadership is intensifying around the economics of deployment.

GOOGL Technical Analysis (1H)Trend: Short-term bullish channel developing
Price: $157.09
Structure: Price is currently grinding upward inside a rising channel with support around $150 and resistance near $159.50.
Key Support & Resistance Levels:
* 🔽 Support: $150.04 → confluence with lower trendline and previous demand zone
* 🔼 Resistance: $159.51 → upper trendline, testing prior intraday rejection level
Volume: Rising steadily with every test of the lower channel support—buying pressure is evident.
RSI: Slight bullish momentum but approaching mid-range (not yet overbought)
🎯 Trade Idea:
* Bullish Scenario: If price breaks and closes above $159.50 with volume, the next leg toward $162–$165 is possible.
* ⚡️ Entry: $158 breakout
* 🎯 Target: $162.50 / $165
* 🛑 Stop: $155
* Bearish Scenario: A breakdown below $155 may trigger a move toward the $150 and $144 zones.
* ⛔️ Entry: Below $154.80
* 🎯 Target: $150 → $144
* 🛑 Stop: $158
🔥 Options GEX & Sentiment Insights
IVR/IVx:
* IVR: 70.6 (elevated, traders are pricing in movement)
* IVx Avg: 58 → implies option prices are above historical norm
Options Flow:
* Puts: 27.1% dominance (moderate hedging activity)
* GEX Bias: Strong Gamma Wall at $157, suggesting price may gravitate toward or stall here unless a breakout occurs.
* Call Walls:
* $160 – Mild resistance
* $162.5 – Potential profit-taking zone
* Put Walls:
* $150 – Strong support area due to GEX negative cluster
* $145–$140 zone – Loaded with high negative GEX: bounce likely if it dips there
⚠️ GEX Highlight:
* The Highest Positive NETGEX is near $157, suggesting market makers prefer pinning price near this zone unless there's a volatility jolt.
💡 Final Thoughts & Strategy
GOOGL is currently in a tight spot where price is climbing within a narrowing channel, and the GEX walls are aligning perfectly around it. It’s a gamma-neutral zone where market makers may suppress volatility short term unless external catalysts break the structure.
Scalp Idea: Use break/retest around $157 or $160 for quick directional trades.
Options
Strategy:
* Neutral-to-Bullish: Consider selling a put credit spread above $150 if expecting price to consolidate.
* Directional Call: Buy 0DTE or 2DTE calls if price breaks above $159.50 with volume.

GOOGL Tariff Relief dips to buy: $156.76 ideal, 150.00 possible GOOGL got sold in panic then bought in fomo.
We of the Fib Faith indulge in logical serenity.
We plan and execute calmly and deliberately.
$156.10-156.76 Bounce would indicate strong bull.
$150.55-150.84 is a Must-Hold or it was a bull trap.
$168.17-170.00 should be an achievable first target.
===============================================

goog to dropgoog weak of m-a and expecting to drop. d1.15
Testing out new quicker strategy lets see how it goes Phi
