Abbott triggered by positive earnings Abbott Laboratories Second-Quarter Results Beat Expectations Despite Lower COVID-19 Testing Sales
The company now anticipates about $1.3 billion in sales from COVID-19 testing products for 2023, compared with the prior forecast of $1.5 billion, "due to current testing dynamics, including lower demand for testing following the end of the public health emergency in May," Chief Financial Officer Robert Funck said on the call.
For the third quarter, Abbott anticipates adjusted earnings of roughly $1.10 per share, according to Funck. Analysts estimate EPS of $1.11.
Technicals:
Cycle Sniper Reversal Filter Headed Nort
Cycle Sniper Bullish ddeviation
Key Resistance: 116 $
Closing above 116 $
Targets: 122 $ and 128 $
ABL trade ideas

Abbott Laboratories in a bull flag.Abbott Labratories - 30d expiry - We look to Buy a break of 109.51 (stop at 106.31)
The primary trend remains bullish.
This stock has seen good sales growth.
Expect trading to remain mixed and volatile.
109.34 has been pivotal.
Posted a bullish Flag formation.
A break of 109.34 is needed to confirm the outlook.
The bias is to break to the upside.
Our profit targets will be 117.51 and 119.51
Resistance: 108.50 / 109.34 / 112.95
Support: 106.80 / 105.96 / 104.00
Please be advised that the information presented on TradingView is provided to Vantage (‘Vantage Global Limited’, ‘we’) by a third-party provider (‘Everest Fortune Group’). Please be reminded that you are solely responsible for the trading decisions on your account. There is a very high degree of risk involved in trading. Any information and/or content is intended entirely for research, educational and informational purposes only and does not constitute investment or consultation advice or investment strategy. The information is not tailored to the investment needs of any specific person and therefore does not involve a consideration of any of the investment objectives, financial situation or needs of any viewer that may receive it. Kindly also note that past performance is not a reliable indicator of future results. Actual results may differ materially from those anticipated in forward-looking or past performance statements. We assume no liability as to the accuracy or completeness of any of the information and/or content provided herein and the Company cannot be held responsible for any omission, mistake nor for any loss or damage including without limitation to any loss of profit which may arise from reliance on any information supplied by Everest Fortune Group.

ABT Abbott Laboratories Options Ahead of EarningsIf you haven`t bought ABT here:
Then analyzing the options chain of ABT Abbott Laboratories prior to the earnings report this week,
I would consider purchasing the 108usd strike price in the money Puts with
an expiration date of 7/21/2023,
for a premium of approximately $2.55.
If these options prove to be profitable prior to the earnings release, I would sell at least half of them.
Looking forward to read your opinion about it.

Bullish sentiment on ABTI like the double bottom ABT just completed. RSI is trending up. The pullback over the last week was on decreasing volume. Looking for a leg up from here.

#ABT Straddle! Notional value - 1.6M$Based on our team's research of the options market, we expect buy activity at the support level or sell activity at the resistance.
We do research and find new opportunities every day.
Please feel free to leave any comments you have and like this idea if you agree with us. Any feedback or comments will be read. We appreciate it all.

ABT a slow moving low beta medical stockABT is Abbott Labs, a well-established medical technology company has had good earnings
twice this year. In the first episode, the price trended down then recovered in a retracement.
I have anchored a long-term mean VWAP and its standard deviations as a means to assess
areas of dynamic support and resistance. One week ago, the price crossed the mean VWAP in
its uptrend. I see this as a good place for a long trade over a month or more. For a stop loss
I will place the stop below the mean VWAP also confluent with two horizontal support lines
as well as the rising support trendline and the POC line of the volume profile
Targets are the first and second standard deviations at about $105 and $110. I will make an
optimal entry from a pivot low on a timeframe of 30-90 minutes.
As the anticipated ROI is relatively small although with reasonable risk, my approach is
a call option for mid-September with a strike in the range of $100-104. I expect this to
yield 25% or more monthly until signs of a pullback or reversal. While the general market
has heightened volatility and controlled chaos, I see adding some trades of slow-moving
low beta stocks to be proper risk management.

ABT Abbott Labs Med Tech Short Setting UpABT is shown on a 4H chart as setting up for a short trade.
Demand and Summply Zones are charted by the LuxAlgo indicator.
Price touched the supply zone five times in December- January then
descended and touched the demand zone several times in
mid-March.
Fundamentally, earnings reports have been solid. Medical stocks
are generally independent of the economy and recession resilient.
ABT has risen off the base of bottoms at support . Relative volume
exceeds that of the past year showing investor/trader interest
has increased. I think it will progress to
touch the supply / resistance zone another once or twice
and then reverse into a solid downtrend. I see this as worth watching
this upcoming week for the reversal.

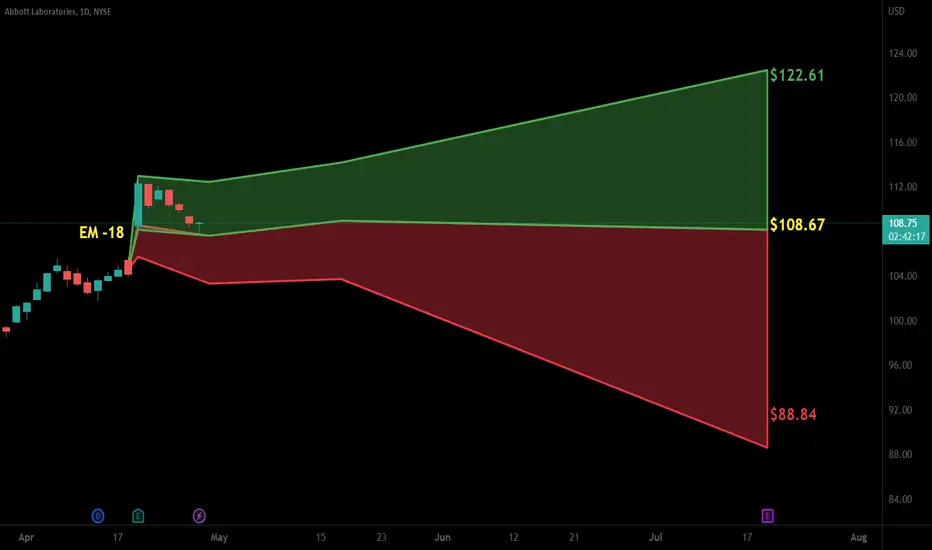
$ABT with a bullish outlook following its earnings #StocksThe PEAD projected a bullish outlook for NYSE:ABT after a positive under reaction following its earnings release placing the stock in drift A with an expected accuracy of 84.62%.
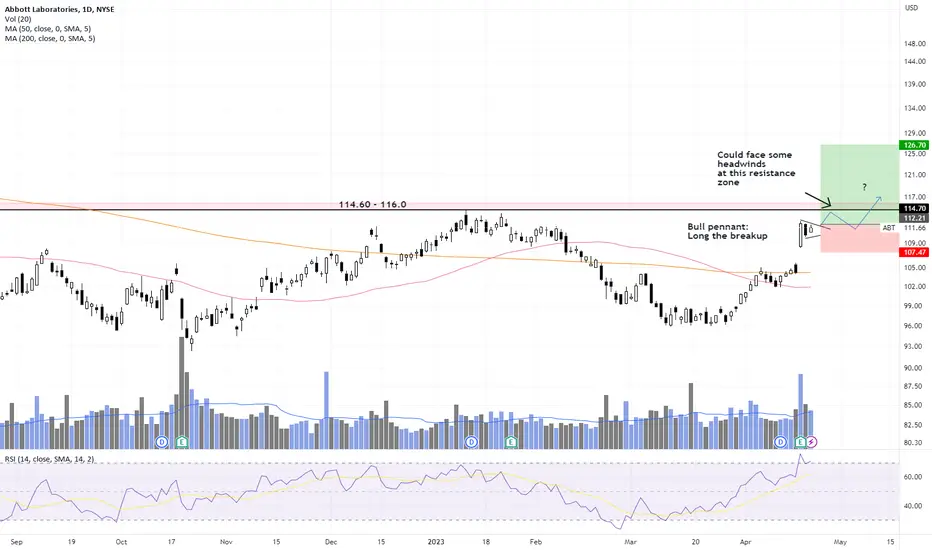
ABT = bull pennantABT had exhibited great momentum for the past few weeks with the recent earnings on 19 Apr propelling it to gap up on high volume.
It appears to be forming a bull pennant right now. It is possible to trade the breakup of this pennant (initial stop just below the gap up candle), however bear in mind that the overhead resistance at 114 - 116 might be difficult to overcome in the near term. Short term trade for time being. Let's see.
Disclaimer: Just my 2 cents and not a trade advice. Kindly do your own due diligence and trade according to your own risk tolerance and don't forget that money management is important! "Let winners run and cut losses short". Take care and Good Luck!
ABT Abbott Laboratories Options Ahead of EarningsAnalyzing the options chain of ABT Abbott Laboratories prior to the earnings report this week, I would consider purchasing
Calls with a 105usd strike price and an expiration date of 2023-5-19, for a premium of approximately $2.48.
If these options prove to be profitable prior to the earnings release, I would sell at least half of them.
I am interested to hear your thoughts on this strategy.

Risky Move on Abbott. ABTA collection of confluent clues. 0.786 retrace on A, quadruple pincers, low volume, RSX OBOS probably peaking, P/C ratio momentally toward green. Swing low within significant count of swing high (? Fib 1:1 ratio timewise). If it doesn't swing, stop loss is close and will not break this bank.
We are not in the business of getting every prediction right, no one ever does and that is not the aim of the game. The Fibonacci targets are highlighted in green with invalidation in red. Confirmation level, where relevant, is a pink dotted, finite line. Fibonacci goals, it is prudent to suggest, are nothing more than mere fractally evident and therefore statistically likely levels that the market will go to. Having said that, the market will always do what it wants and always has a mind of its own. Therefore, none of this is financial advice, so do your own research and rely only on your own analysis. Trading is a true one man sport. Good luck out there and stay safe.

#ABT weekly reversalHello dear Traders,
Here is my idea for #WMT
Price closed above yellow line
Targets marked in the chart
Invalidation level marked with red line
IV30 % Rank: 0% Subdued
Good luck!
❤️Please feel free to ask any question in comments. I will try to answer all! Thank you.
Please, support my work with like, thank you!❤️

ABT WEEKLY (ABBOTT LABORATORIES)RULES:
-If price break Point 2, 4, 6, or 8 cancel the setup
-Price needs to break Point 1, 3, 5, or 7 to confirm the setup
When price reach the 100FE(BLUE BOX) it normally does a pullback/retest or reversal
The market can Truncate(fall short)

$ABT with a Bullish outlook following its earnings #Stocks The PEAD projected a Bullish outlook for $ABT after a Negative over reaction following its earnings release placing the stock in drift C with an expected accuracy of 42.86%.

ABT Impulse and correctionThis is a very simple and straight forward analysis in which there is an impulse and a correction.
.
it has broken out of the correction and also the resistance line

Short $ABT from 56.253rd test of channel and we put our stop just above last high, which was a double top.
Entry: 104.25
SL: 107.25
TP: 93.5

Abbott (ABT) Laboratories long positionAbbott (ABT) Laboratories long position
Entry level: $95.45
Take profit: $104.11
Stop loss: $91.85

$ABT with a Bullish outlook following its earnings #Stocks The PEAD projected a Bullish outlook for $ABT after a Negative Under reaction following its earnings release placing the stock in drift D with an expected accuracy of 100%.

ABT: Turnaround?Abbott Labratories
Short Term - We look to Buy at 105.03 (stop at 102.52)
Buying pressure has confirmed an initial rejection from the approach towards the key psychological level of 101.21. This is positive for sentiment and the uptrend has potential to return. There is scope for mild selling at the open but losses should be limited. Further upside is expected although we prefer to buy into dips close to the 105.00 level.
Our profit targets will be 112.00 and 114.00
Resistance: 112.00 / 118.00 / 140.00
Support: 105.00 / 95.00 / 61.30
Please be advised that the information presented on TradingView is provided to Vantage (‘Vantage Global Limited’, ‘we’) by a third-party provider (‘Signal Centre’). Please be reminded that you are solely responsible for the trading decisions on your account. There is a very high degree of risk involved in trading. Any information and/or content is intended entirely for research, educational and informational purposes only and does not constitute investment or consultation advice or investment strategy. The information is not tailored to the investment needs of any specific person and therefore does not involve a consideration of any of the investment objectives, financial situation or needs of any viewer that may receive it. Kindly also note that past performance is not a reliable indicator of future results. Actual results may differ materially from those anticipated in forward-looking or past performance statements. We assume no liability as to the accuracy or completeness of any of the information and/or content provided herein and the Company cannot be held responsible for any omission, mistake nor for any loss or damage including without limitation to any loss of profit which may arise from reliance on any information supplied by Signal Centre.

Short ABT @ 107.45 Breakout FractalABT just closed below its last bearish fractal of 107.55, and after having wandered around the balance line june 28th.
This falls in line with an apparent rejection of the balance line on the weekly, so we have the current price below both the daily and weekly balance lines.
Weekly showed its first read bar on the weekly today, so everything about it looks like a good bearish opportunity.
However, no one know where the market is headed so as always, stop loss is a close above the daily balance line, and target, whenever the trend ends, also signaled by closing above the daily balance line.

Lagging Ending Diagonal on Abbott. ABTWe are probably at the end of this zigzag in that we are forming what appears to be a lagging diagonal. These tend to be final in a local correction, so it may be that this is the last short I will be putting on this one for a while.
We are not in the business of getting every prediction right, no one ever does and that is not the aim of the game. The Fibonacci targets are highlighted in purple with invalidation in red. Confirmation level, where relevant, is a pink dotted, finite line. Fibonacci goals, it is prudent to suggest, are nothing more than mere fractally evident and therefore statistically likely levels that the market will go to. Having said that, the market will always do what it wants and always has a mind of its own. Therefore, none of this is financial advice, so do your own research and rely only on your own analysis. Trading is a true one man sport. Good luck out there and stay safe.

$ABT with a Bullish outlook following its earnings #Stocks The PEAD projected a Bullish outlook for $ABT after a Negative over reaction following its earnings release placing the stock in drift C with an expected accuracy of 50%.

Bullish H&S...Waiting for breakoutEntry buy stop at 117.10 and target 124.33 if price breaks through the nike line of the current bullish pattern
