ADB trade ideas

$ADBE - cup and handle formationAdobe lining up for a small rally?
ATR is settling
Stochastic has room to grow
Histogram and MACD are aligned nicely
ADOBE - Bullish To $600 ?Morgan Stanley says another 10% correction is needed before bull market can resume

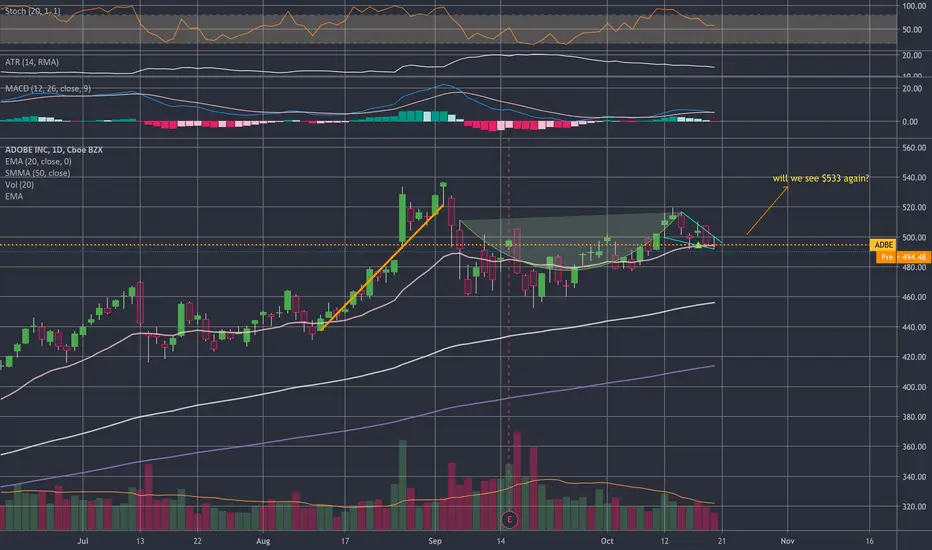
Consolidation taking place...Adobe is in an uptrend. And since the summer we have seen consolidation taking place for the stock.
Now there has been an upward breakout with some consolidation right after that. We see that as a back test. We therefore expect higher prices.
$ 520 is our first price target for Adobe.


IronTariHi guys!
This is a new iron condor 4weeks 8% Strikes.
See you in a month! FoSubscribe and follow the strategy!
Enjoy your wallet!
Tari.

over 525over the top trendline we can see a new 52w high imo, id sit on my hands until confirmation here

ADBE supported by 20 day averageNASDAQ:ADBE was supported by the 20 day average yesterday, momentum (ADX) is low, +DI is positive, RSI is neutral. Above there is a triangle, if it breaks the resistance we see a nice long setup


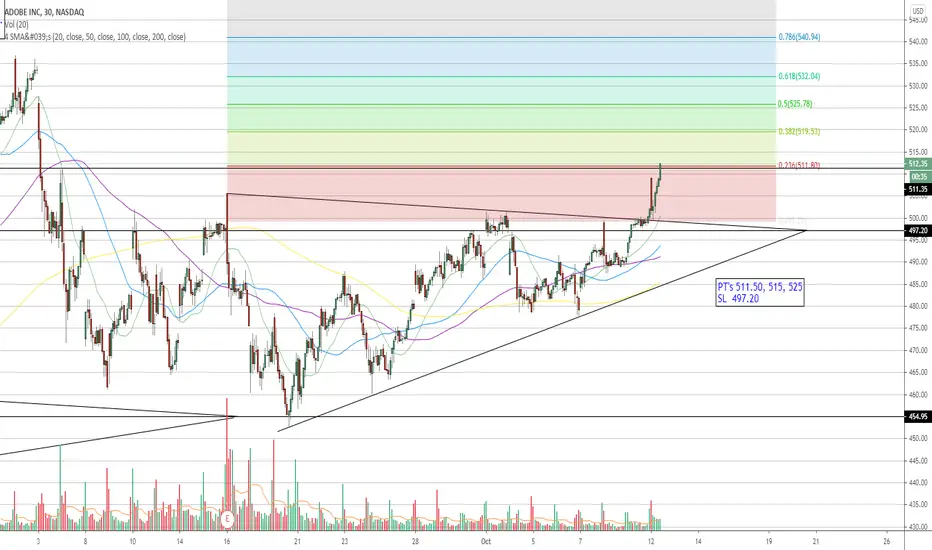
ADOBE INC. LONG📈 NASDAQ:ADBE LONG D1
🛒BUY above = 503
🎯Target1 = 518.40
🎯Target2 = 528
🛑Stop loss or cancel trade = 477.80
🙈Recommended risk = (2%-3%)

$ADBE on the move now Took her a while to get here but lets roll. Just doing my daily charting enjoy:)


LRS SMA IndicatorLinear Regression Slope (LRS) applied to SMA.
Shades green when value is > 0 and prices closes > SMA.


$ADBEFollow trend line through resistance levels and scalp winnings. Tech stock close to ATH so things could change day to day.
- AH trading has stock over 499 resistance line. If that holds try to grab at those levels.
- Would much rather enter closer to 490-495 with either a bounce off support or 200D on a 5Min chart
- Gap up on 10/1 - Only reason I could see is second wave of COVID fears driving tech again, no other news.
- Just a guess, but 509 resistance seems like BO "Breakout" opportunity
Trade at your own risk, I didn't hit your buy/sell button.


Divergence in ADBEThere is a divergence in ADBE. However, MACD points out that the price is falling and indicates that it is a matter of waiting to trade short, although the RSI points out the opposite.

It´s never too late to buy $ADBE It´s never too late to buy a stock. No one can determine wether it´s on its cealing or not. Sometimes all you need is historical data and a clear long signal.
It has been now more than 4 years since Adobe´s stock price started to increase at good rithm. For the past weeks it has been quite blurry to determine what could happen.
$ADBE has broken the triangle pattern created since its last highest, upwards. It is above the 50MA, the RSI has been latheralizing while the MACD forrest was negative. But now the MACD is about to turnaround positvely, plus the RSI is above the 50lvl. We can see this as clear long signals on a stock price to which I personally see no roof yet.
