Adobe: Downhill! ⛷️The ADBE price has been dropping since yesterday. Our primary expectation is that this is merely the beginning of a larger descent, as we now consider the white wave (b) to be completed and locate the price in the same-colored wave (c). This wave should now fall below the resistance at $506.92 and only come to an end around $380. However, there is an alternative to consider, to which we assign a probability of 30%. This option would shift the high of the white wave alt.(b) slightly higher.
ADB trade ideas

ADBE - Shortt IdeaAdobe potential move to 585-590 zone.
Today we have the Fed talking in the afternoon. We will see how the market reacts to it. However I trust technicals, and I believe in order to make good money in this market, you need to enter when institutions do, and get out when all retailers jump in. Too many confirmations kill profits.
This is a riskier idea, and I would be extra careful with my risk management.

Adobe Inc. (‘ADBE’), DailyShares of Adobe Inc. (symbol ‘ADBE’) have performed exceptionally well over the last 3 months, reaching a 2-year high. The company’s earnings report for the fiscal quarter ending November 2023 is due for release on Wednesday 13th of December, after market close. The consensus EPS is $3.32, well up from $2.78 in the same quarter last year.
‘ The company's share price rose by around 7% in the last quarter and the financial image is also reflecting this positive update. The total assets outweigh the total liabilities at a ratio of more than 2:1 while the current ratio as of 31/08/2023 is at 125% meaning that the company is more than able to repay its short term liabilities with the current assets at hand. The net income is at a 2 year high while the return on equity is just shy of 35%. This means that the company is utilizing its shareholders equity to generate income which is viewed positively by its shareholders and making the company an attractive addition to their portfolios.’ said Antreas Themistokleous, market analyst at Exness.
From the technical analysis perspective the price has been bullish throughout the whole of the quarter with some rather minor corrections. The psychological resistance of the round number at $625 has proven to be strong enough to push the price to the downside in recent sessions and also pushed the Stochastic oscillator back in neutral levels. At the time of this report being written the 50 day moving average was trading above the 100 day moving average indicating that the overall bullish momentum is still valid. In the case that the recent correction continues in the near short term then the first point of major support could possibly be found around the $550 price area which consists of the dynamic support between the 2 moving averages, the psychological support of the round number and is also just above the 61.8% of the monthly Fibonacci retracement level.

Adobe turbulenceGiven Adobe's earnings report on Wednesday this week, the trading idea is to buy Adobe at $610 and target $640 in the short-term.
If $640 holds as a resistance level, the recommendation is to initiate short positions to target $560.

Adobe Inc. (‘ADBE’), DailyShares of Adobe Inc. (symbol ‘ADBE’) have performed exceptionally well over the last 3 months, reaching a 2-year high. The company’s earnings report for the fiscal quarter ending November 2023 is due for release on Wednesday 13th of December, after market close. The consensus EPS is $3.32, well up from $2.78 in the same quarter last year.
‘ The company's share price rose by around 7% in the last quarter and the financial image is also reflecting this positive update. The total assets outweigh the total liabilities at a ratio of more than 2:1 while the current ratio as of 31/08/2023 is at 125% meaning that the company is more than able to repay its short term liabilities with the current assets at hand. The net income is at a 2 year high while the return on equity is just shy of 35%. This means that the company is utilizing its shareholders equity to generate income which is viewed positively by its shareholders and making the company an attractive addition to their portfolios.’ said Antreas Themistokleous, market analyst at Exness.
From the technical analysis perspective the price has been bullish throughout the whole of the quarter with some rather minor corrections. The psychological resistance of the round number at $625 has proven to be strong enough to push the price to the downside in recent sessions and also pushed the Stochastic oscillator back in neutral levels. At the time of this report being written the 50 day moving average was trading above the 100 day moving average indicating that the overall bullish momentum is still valid. In the case that the recent correction continues in the near short term then the first point of major support could possibly be found around the $550 price area which consists of the dynamic support between the 2 moving averages, the psychological support of the round number and is also just above the 61.8% of the monthly Fibonacci retracement level.

$ADBE Analysis, Key Levels & TargetsNASDAQ:ADBE Analysis, Key Levels & Targets
Time to start looking for some deals….
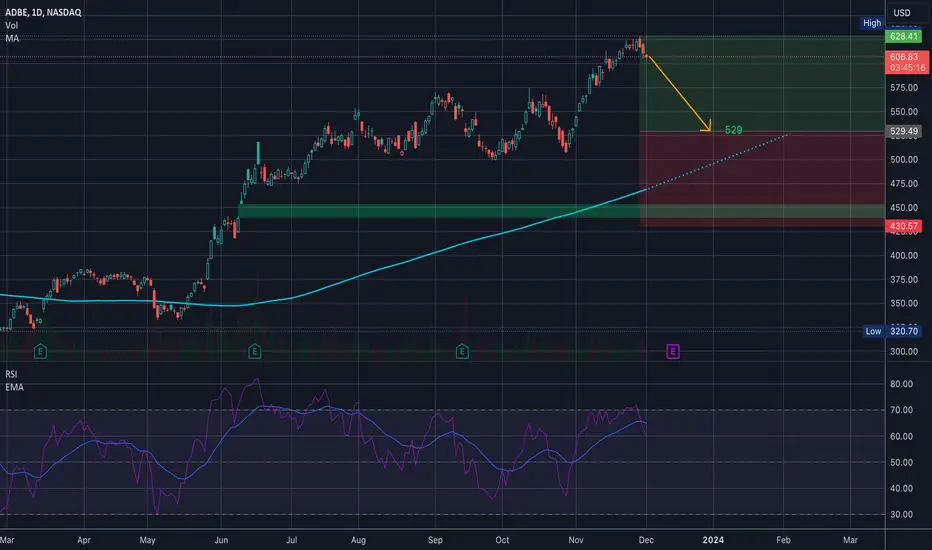
Adobe would be a good buy at 529…. at least for a swing. I’ll do a deeper dive here soon but per 5year volatility we’re due to see 529
Alerts set… let’s get it…
Time to book profit in Adobe
After huge rise for last month, is it right tim eto book profit in Adobe or should we hold onto it for another month?

Adobe AnalysisJust closed my position with a 39% gain! 🚀 Adobe is currently trading at $620, showcasing a strong bullish trend with potential for further growth. Based on current momentum, there are two key scenarios to watch:
1. Bullish Continuation: The price could surge towards the $640 mark, extending its bullish trajectory.
2. P otential Retracement: Alternatively, if it breaks below the $620 level, we might see a pullback to around $600.
Stay alert for these pivotal movements. Both scenarios offer significant trading opportunities. Keep an eye on the market and stay tuned for more updates! 🌟
#Adobe #StockAnalysis #TradingView

Idea for ADBEI see it gapping to 625 by end of week next week. Based on indicators and the patterns im seeing. I do see it going down slightly at first for a healthy pullback but otherwise bullish. Let me know what you think. going to hop in calls after the first 30 min monday and swing for the week.

Adobe Inc. (NASDAQ: ADBE) Stock Gains
In the latest market close, Adobe Systems (ADBE) reached $565.47, with a +0.32% movement compared to the previous day. The stock outpaced the S&P 500's daily gain of 0.18%. On the other hand, the Dow registered a gain of 0.1%, and the technology-centric Nasdaq increased by 0.3%.
Shares of the software maker had gained 7.02% in the past month. In that same time, the Computer and Technology sector gained 3.65%, while the S&P 500 gained 3.08%.
Price Momentum
ADBE is trading near the top of its 52-week range and above its 200-day simple moving average.
We can see it from the chart forming an Horizontal Trendline at the Crest and Trough trying to form a breakout.
What does this mean?
Investors have been pushing the share price higher, and the stock still appears to have upward momentum. This is a positive sign for the stock's future value.

ADBE Call Credit SpreadsADBE bouncing off resistance level at 570.
Looking to sell short dated call credit spreads between 570 - 575.
Close the trade if price > 573

ADBE: Triple TopIt seems like Adobe is getting major resistance at around $561. Looks like a "triple-top" to me, my guess is that it goes down from here. Considering the DJI, SP500 and NDQ are all reaching overbought levels in a downward trend, I'd say now is a good time to get out, or short if you can. If it breaks through $550, then it looks like the next key support/resistance levels are around $510.

ADBE to Reach 650 by Year-EndWeekly Chart of ADBE
ADBE has bounced from an important support level (green band).
Corrective Wave 4 is forming.
ADBE will go down to 530 next week (starting 6 Nov) to complete Wave 4.
Thereafter, there will be a sharp Wave 5 going up to the resistance level (red band).

Price will keep raising till at least January 2024The wave analysis on NASDAQ:ADBE (based on timing, swing trading, volumes, Gann and Elliott and much more) suggests that price will keep raising at least till January, at most till May/June 2024.
This type of analysis shows great advantages over technical analysis: when a swing of a wave is broken to the upside or downside before reaching its shorter duration, we can know in advance how long we can keep short or long positions opened.
Each day we can calculate statistically what is the probability that price goes up or down, to help traders manage the risk.
Stay tuned for further analysis on US stocks to discover more.

ADBE NeutralADBE Channel for almost 40 years.
Fibonacci Extensions
1- $675.20
1.168- $926.02
2.168- $1331.88

ADBE is coming closer to an important resistance Strong AI beneficiary, NASDAQ:ADBE , had a great move since Oct'22 bottom, advancing more than 100%, and is still in stable uptrend. What are the price levels long investors and traders need to be cautious about?
My structural analysis of price dynamics shows that there is an important level of mid-term resistance in 590-625 that may serve as the topping area and lead to start of the correction towards important support zone 510-466.
This support zone is the main crossroad between two counts presented. If 466 level will not hold under any perspective selling pressure, then macro-bearish white count becomes operative with lows below Oct 22 to be expected.
If price manages to stay above this 510-466 level, then at least one more leg-up towards 680+ would be my main expectation.
Another important cautious sign from the volume perspective, is escalating weekly distribution candle in Sep, with yet no contra-accumulation bars.
It is still early and inappropriate to take decisively bearish stance, due to price being in supportive uptrend and not breaking any even short-term moving averages. The purpose of this analysis is to provide potential framework for important resistance area ahead for any long positions already established.
The analysis is valid until price stays below 625. Decisive move above 625 will force me to reconsider and re-do the analysis.
Important notice: Elliot waves and fibonacci retracements are a very subjective form of analysis and I don't personally trade out of them. I use them only for the purpose of gauging structural potential of any assets, that allows me to put more confidence when low-risk trading set-up emerges. Author's personal multi-years trading experience convinced him that analysis and opinion doesn't pay, only price pays and that one shall not ever argue with price

Adobe Inc. NASDAQ stock today Wide-moat Adobe reported good third-quarter results, including revenue and non-GAAP EPS that exceeded the top end of guidance and our expectations along with it. We characterize management’s fourth-quarter guidance as in line with investor expectations, which given recent strength and with Firefly AI now generating revenue, could be interpreted as a slight disappointment. We think this mentality mainly misses the mark given such a short-term focus. Further, management will provide fiscal 2024 targets within its fourth-quarter results in December so in-line guidance for one quarter matters less to us here. To begin to accommodate recently announced price increases in the area of 10% for various Creative Cloud and single app instances, we are modestly raising our growth estimates over the next several years. Our fair value estimate therefore increases to $510, from $485 previously, although after a strong run, we see shares as fairly valued.

ADBE - Good 'Ol Head & Shoulders ADBE is forming a Good old classic Head and Shoulders pattern at the top.
I would wait for the that tiny little gap to fill on the top and build short position.
Short Entry between 535-540
Downside Target#1 - 440
Downside Target#2 - If you are really lucky, 395

ADBE Short - This trade is with the daily and H4 trend
- There is a pattern on M15 and M30
- There is a lot of divergence
- This is a fast-moving pair so there is high stop loss but it should fall to the bottom (500)

trend resistance can send it lower 🐼ADBE make or break level here, rejection at trend resistance sends it to 484 🎯
break past TL/426🟢 and push to 567 should follow 🎯
boost and follow for more.. thanks 💛

ADOBE A good buy for the long runAdobe Inc is trading between the MA50 and MA100 (1d) on a Fibonacci Channel that depicts very accurately the strong 1 year uptrend.
The first phase traded inside Fibonacci 0-1, the second is trading inside 1-2.
Trading Plan:
1. Buy on the current market price.
Targets:
1. 700.00 (All Time High and Fibonacci 3.0 level).
Tips:
1. The RSI (1d) crossed over its MA, after rebounding on the Buy Zone. A strong bullish signal.
Please like, follow and comment!!

ADBE, Second BEAR-Fractal, SHORT-Momentum DOOMSDAY Incoming!Hello There!
Welcome to my new analysis of ADBE. This stock has been massively battered by the major bear market decline setup in the gigantic bear channel. This stock did not exceed any new highs and did not have the potential to emerge with new bull momentum. The bears are still present within this stock and this is exactly why the bear momentum for this stock can accelerate heavily any time soon. There are several major bearish indications that are underlining the bearish scenario for the stock in an overwhelmingly precarious way.
Three reasons why the bear doomsday scenario for the stock is present, starting any time soon:
1.) Massive Liquidations: Over 250 Billion positions have been liquidated within the previous bearish doomsday market decline wave towards the downside.
2.) Weak Momentum: The momentum with which the recent meager recovery wave setup is highly fragile and is likely to turn anytime soon.
3.) Major Short-Side Positioning: A vast amount of institutional and smart money operators are positioning their selves on the short side. Always an important indication especially with retail traders positioned in the other direction.
Why shorting the stock through the upcoming second bear doomsday scenario will be the best approach in the current and upcoming market conditions:
1.) Second bearish ascending wedge fractal: The stock is going to complete exactly the same bearish ascending wedge fractal towards the downside once again.
2.) Total-Return Approach: By shorting the stock a trader has the candidature to a total-return approach, the trader is profiting when prices fall and at other times when they go up.
3.) Liquidation Acceleration: Once the whole ascending fractal has been completed it will trigger a fast-paced bearish wave making profits much faster than in an uptrend.
The most prevalent determining indications that are going to activate the upcoming bear market scenario wave for the stock:
As it is seen in my chart ADBE completed the huge bearish ascending triangle fractal exactly by moving into the upper distribution zone from where it emerged with the pullback towards the downside and set up the massive 250 Billion bearish liquidation wave towards the downside. This wave developed very fast and by positioning oneself before this huge bearish wave and completion of the fractal towards the downside a trader could make a big load of profit in the market.
Now, ADBE is still trading within the gigantic descending channel formation in which it has the most prevalent upper resistance distribution channel which has been the origin of the massive bearish waves towards the downside before and is now already setting up the upcoming 300 Billion bearish liquidation wave towards the downside which is going to activate the completion of the second ascending wedge fractal and the preceding wave C towards the bearish direction.
In the next times, the whole bearish ascending wedge fractal will be completed with the breakout below the lower boundary followed by the breakout below the 65EMA and 100EMA from where the bearish trend acceleration is going to unfold huge accelerations towards the downside and the severe bearish continuations towards the lower target zones. Especially, in this case, the market could still continue beyond this level in the bearish direction.
Upcoming Perspectives and the major underlying factors that are primarily important for consideration on the short side for the stock, the sector, and the economic field:
It has to be mentioned that an economic field with high interest rates, spreading inflation, a stagnation within the sector is setting up the determination to increase this whole bearish wave development, especially with a more bearish volume moving into the market. Also, highly determining in this case is the actual technology developments because when they reverse in an economic field this will have massive bearish effects on the stock as well.
Now, for traders it is highly important to follow such market situations with the appropriate setup within the market, especially in such times it is necessary to have the right positioning within the market because a massive bearish pressure acceleration can start anytime soon considering a huge acceleration in the inflation, a smart money operator bearish market making in which the bearish conclusion will be inevitable, an expiring futures market in which a lot of futures turn to an bearish volatility in the market. This is why traders need to position their selves before all these heavy bearish scenarios are set up.
In this manner, thank you everybody for watching my analysis of ADBE. Support from your side is greatly appreciated.
VP

