WEEKLY ANALYSIS OF BRISTOL-MYERS SQUIBB COHI FRINDS
i recomend to keeping this stocks and too buy for this week
BRM trade ideas

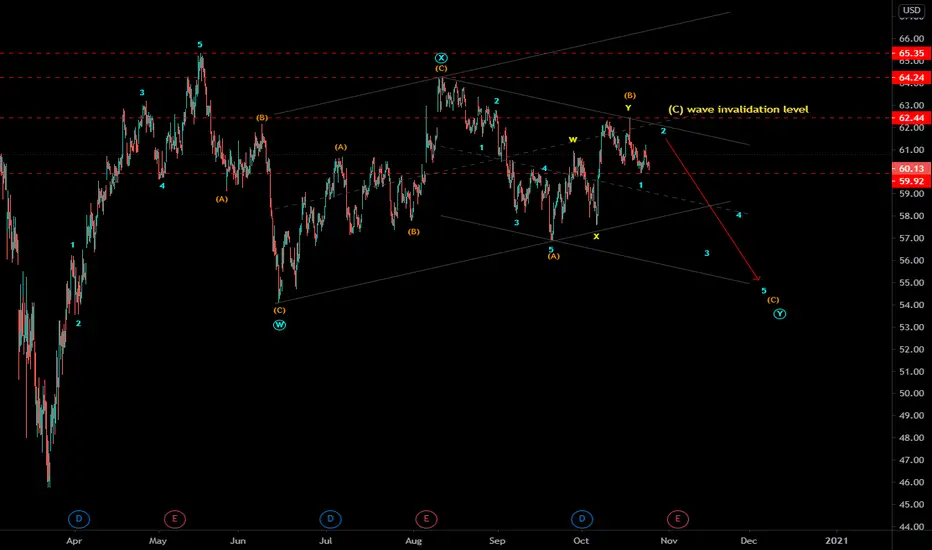
BMY - Elliottwave analysis BMY - It is in zigzag ABC wave of (Y) wave down cycle in complex correction and under-performing the SPX. Sell near 61.00-61.70 zone with stops above 62.45 for initial target below 57 level. Overall (Y) wave will end at around 54 or lower level.
Give thumbs up if you really like the trade idea.

Wedge peak aheadOpened a position today when the price bounced off the daily MA50.
Currently it sits right on a support line which also acted as a resistance the last couple of month.
Since it just broke through that resistance a week ago I see the current pullback as a retest of this area so that it becomes support.
On the weekly I recognised a slightly rising wedge (please let me know if it is feasible to ignore the breakdown in march - the circled one).
The PA needs to make a decision which way it wants to break the wedge cause we are getting close to its peak.
I believe in an upward move since the trend seems to me slightly bullish.
Entry: 60.85
TP1: 65
TP2: 68
SL: 57


BMT: Bullish Wave In ProgressContracting Triangle
TP 1 = 63.4 near trend line
TP 2 = 68.23
TP 3 = 72.50 extended target
Please don't forget to FOLLOW, LIKE, and COMMENT ...
If you like my analysis:)
Thank you and Good Luck!

BMY BUY OR LONG , TARGET UP TO $77.78BMY pattern confirmation Symmetrical triangle , the price is above the MA50 and MA200 support averages of the daily frame.
BMY buy : $63.5 +- 0.5
BMY target : $77.78
Stop loss : $60 (5-6%)
Wish you a good deal!

$BMY Bristol -Myers | Strong Support Bounce
-Moving averages are in providing strong cluster of support for the stock.
-Rising trendline support
-Horizontal support.
Potential trade in the short term to $64.00-$66.70
Downtrend is first resistance above to consider
PLEASE GIVE US A LIKE IF YOU FIND OUR CONTENT HELPFUL, THANK YOU.

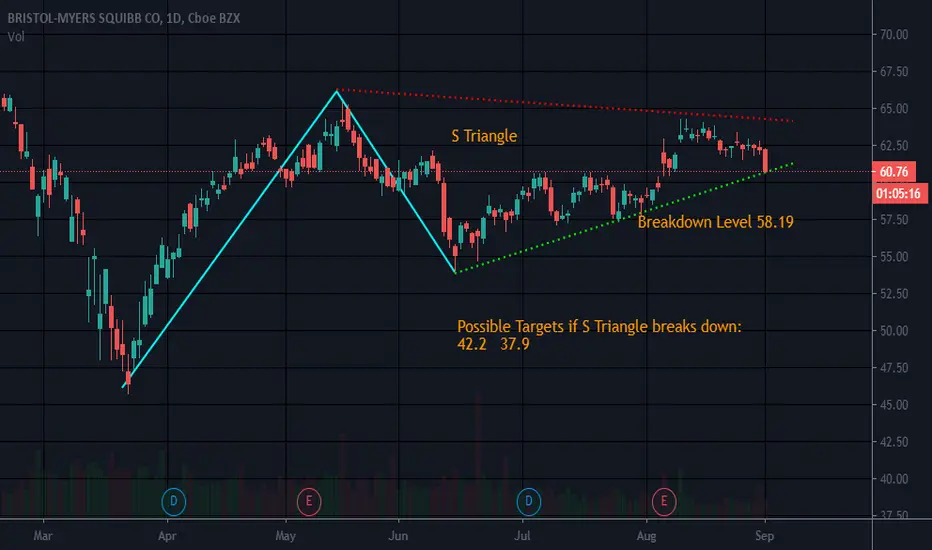
Symmetric TrianglePossible break to the downside. If falls under 58.19, it may price may go down
Hopefully not (o: Some like to go short though. I do not but this is not looking good. Things change daily though
Possible breakdown T2: 25
Just an observation

BMY AUGUST 24Price went out of range so I think it is going to move back because of an ascending EMA
and MACD crossing for long.
Be careful trading, it is risky.

BMY buy at 65.44 with profit taking at 81.8 BMY, which is Bristol Myer Squibb Co not to be confused with the grocery store Bristol Farms is an Medical company that manufactures doctor prescribed drugs. This company has not made much movement since the beginning of 2020 from a price perspective but has made quite a splash from a fundamentals perspective. Their earnings the last 3 quarter is 30%, 56%, and 38%. Their sales is 33%, 82%, and 61%. This means the company is pretty outsanding in growing sales and making more money from every sale. The handle formation is providing a great entry point at $65.44 if it is able to reach past this area and the cup is providing a late entry at $68.44. This 3 dollars doesn't sound like much but on a percent basis it is about 4.5%, which if your stop loss is 7% below your buy point you might easier get stopped out due to volatility. The other pro of this is that Fidelity Contrafund owns about .4% of the company's share, which is almost 90mm shares and that isn't a small number. We shall see what happens on the day this stock breaks out if it ever does.

BMY trade idea- Rob Smith's THE STRATI have been learning about THE STRAT by Rob Smith. Wanted to share a trade I made using this method. It is still open at this time. If my method is off please let me know.
Time continuity: Although the daily shows red we were actually green on most timeframes.
Had an inside on the daily and 60. Waited on the break of an inside 15 and took the trade at 61.40. Maybe this was early; should have waited for the next 60 min candle to print and break the inside candle high/low.


$BMY Potential Breakout Target for Bristol Myers
On strong watch for a huge breakout above longterm downtrend.


BMY = Long Term Bullish Chart = Cup-N-Handle !!!!! 8/2/2020What up you crazy mother-flowers !!!!!!
Check out BMY on the freaking long term chart!!!
= Cup-N-Handle on the monthly chart and targets on the chart>
= Also the weekly chart you see a possible Rising 3 methods in the making above 20-moving-average but not confirmed yet>
= You will find Inverse head and shoulders on the Daily/Weekly chart witch is working on the move up from the right shoulder>
= I'm looking into a long term option trade on this one here>
Let me know what ya'll think....

ABC BullishEarnings 8-6 BMO
I think this is a gr8 stock with a gr8 dividend..Is it my imagination or does it seem to struggle?
ABC patterns should only be traded after break out with an up trend in place
Not a recommendation
Good traders are like good athletes. We have what it takes, we just have to develop our skills
Lonely job...a trader has to be dedicated. Be willing to take a loss if it means losing more. Then the next day, when the stock explodes upward after we let it go, we have to brush it off and move forward. Learn from the mistake, yet try not to hold on to it
Can be a hobby...Just an expensive one if not careful! Or a mode of income..it is what we are


