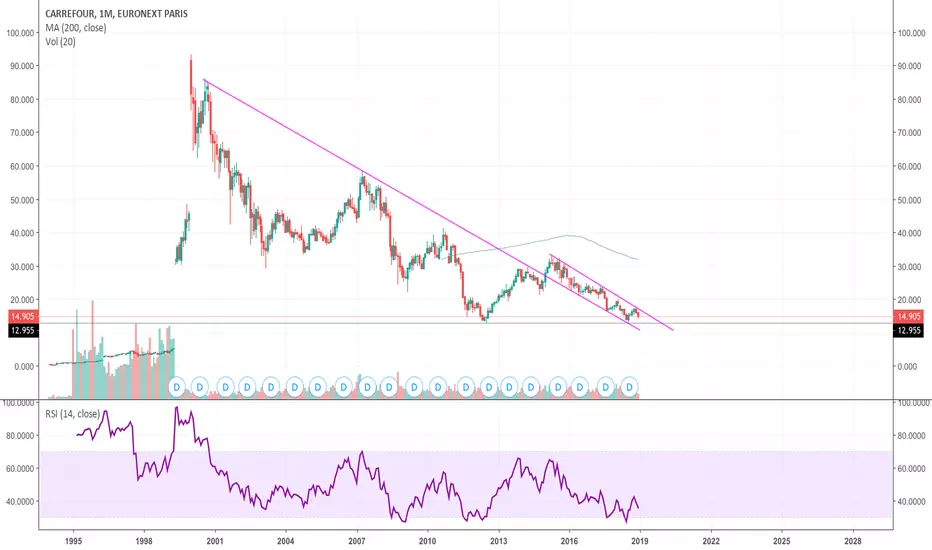
Wycoff Accumulation Phase?Carrefour is one of the world's largest grocery retailers, think of it as the European Walmart. But the execution of the business by management could not be any different. We are talking about a 90% decline since it's highs in 1999. Failed market expansion, competition from budget retailers like Aldi and Lidl, online retailers have taken market share. This company has suffered and anyone bag holding this must have written this off as a bad nightmare.
The chart suggests that we could be back in an accumulation phase. We are sitting at the 25 year trend line resistance, if this is broken and we reclaim the POC, this could set up for a nice counter rally.
This chart is more a warning than an investment idea. Don't get caught out holding bags, especially not in retail names with weak moat and intense competition.
CAR trade ideas

Investment Opportunity CAEven if CA is currently accumulating order in long term, we can see a beautiful Wyckoff in place (accumulation), the main reason of this investment opportunity is that the liquidity was taken from SC, and the brake of structure happen, I'm expecting now the price reach "BC", this is really a long term investment as the price is moving slowly but the technical analysis was really interesting so I share it.

Fading into Carrefour's leg up.Carrefour - 30d expiry - We look to Sell at 17.48 (stop at 18.04)
The primary trend remains bearish.
Bespoke resistance is located at 17.50.
Resistance could prove difficult to breakdown.
Price action is forming a bullish flag which has a bias to break to the upside.
We look for a temporary move higher.
Preferred trade is to sell into rallies.
Our profit targets will be 16.08 and 15.68
Resistance: 16.70 / 17.00 / 17.50
Support: 16.00 / 15.50 / 15.00
Disclaimer – Saxo Bank Group.
Please be reminded – you alone are responsible for your trading – both gains and losses. There is a very high degree of risk involved in trading. The technical analysis , like any and all indicators, strategies, columns, articles and other features accessible on/though this site (including those from Signal Centre) are for informational purposes only and should not be construed as investment advice by you. Such technical analysis are believed to be obtained from sources believed to be reliable, but not warrant their respective completeness or accuracy, or warrant any results from the use of the information. Your use of the technical analysis , as would also your use of any and all mentioned indicators, strategies, columns, articles and all other features, is entirely at your own risk and it is your sole responsibility to evaluate the accuracy, completeness and usefulness (including suitability) of the information. You should assess the risk of any trade with your financial adviser and make your own independent decision(s) regarding any tradable products which may be the subject matter of the technical analysis or any of the said indicators, strategies, columns, articles and all other features.
Please also be reminded that if despite the above, any of the said technical analysis (or any of the said indicators, strategies, columns, articles and other features accessible on/through this site) is found to be advisory or a recommendation; and not merely informational in nature, the same is in any event provided with the intention of being for general circulation and availability only. As such it is not intended to and does not form part of any offer or recommendation directed at you specifically, or have any regard to the investment objectives, financial situation or needs of yourself or any other specific person. Before committing to a trade or investment therefore, please seek advice from a financial or other professional adviser regarding the suitability of the product for you and (where available) read the relevant product offer/description documents, including the risk disclosures. If you do not wish to seek such financial advice, please still exercise your mind and consider carefully whether the product is suitable for you because you alone remain responsible for your trading – both gains and losses.

Carrefour in a flag.Carrefour - 30d expiry - We look to Sell a break of 15.97 (stop at 16.55)
Although the bulls are in control, the stalling positive momentum indicates a turnaround is possible.
A break of the recent low at 16.00 should result in a further move lower.
The primary trend remains bearish.
16.00 continues to hold back the bears.
Bearish divergence can be seen on the daily chart (the chart makes a higher high while the oscillator makes a lower high), often a signal of exhausted bullish momentum, or at least a correction lower.
Price action looks to be forming a bearish flag/pennant.
Our profit targets will be 14.52 and 14.12
Resistance: 16.40 / 16.66 / 17.00
Support: 16.00 / 15.50 / 15.00
Disclaimer – Saxo Bank Group.
Please be reminded – you alone are responsible for your trading – both gains and losses. There is a very high degree of risk involved in trading. The technical analysis , like any and all indicators, strategies, columns, articles and other features accessible on/though this site (including those from Signal Centre) are for informational purposes only and should not be construed as investment advice by you. Such technical analysis are believed to be obtained from sources believed to be reliable, but not warrant their respective completeness or accuracy, or warrant any results from the use of the information. Your use of the technical analysis , as would also your use of any and all mentioned indicators, strategies, columns, articles and all other features, is entirely at your own risk and it is your sole responsibility to evaluate the accuracy, completeness and usefulness (including suitability) of the information. You should assess the risk of any trade with your financial adviser and make your own independent decision(s) regarding any tradable products which may be the subject matter of the technical analysis or any of the said indicators, strategies, columns, articles and all other features.
Please also be reminded that if despite the above, any of the said technical analysis (or any of the said indicators, strategies, columns, articles and other features accessible on/through this site) is found to be advisory or a recommendation; and not merely informational in nature, the same is in any event provided with the intention of being for general circulation and availability only. As such it is not intended to and does not form part of any offer or recommendation directed at you specifically, or have any regard to the investment objectives, financial situation or needs of yourself or any other specific person. Before committing to a trade or investment therefore, please seek advice from a financial or other professional adviser regarding the suitability of the product for you and (where available) read the relevant product offer/description documents, including the risk disclosures. If you do not wish to seek such financial advice, please still exercise your mind and consider carefully whether the product is suitable for you because you alone remain responsible for your trading – both gains and losses.

Will Carrefur create cup and handle?After checked in M1 and W1 i saw that distribution phase already finished and seems that M1 will create a cup and handle pattern which makes confluence with acumulated squezze momentum bullish divergences

To trade a Carrefour range.Carrefour - Intraday - We look to Sell at 17.47 (stop at 17.91)
Price action continued to range between key support & resistance (16.00 - 17.50) and we expect this to continue.
Daily signals are mildly bearish.
Bespoke resistance is located at 17.50.
17.50 has been pivotal.
We look for a temporary move higher.
17.50 continues to hold back the bulls.
Our profit targets will be 16.37 and 16.07
Resistance: 17.00 / 17.50 / 18.00
Support: 16.50 / 16.30 / 16.00
Disclaimer – Saxo Bank Group. Please be reminded – you alone are responsible for your trading – both gains and losses.
There is a very high degree of risk involved in trading. The technical analysis , like any and all indicators, strategies, columns, articles and other features accessible on/though this site (including those from Signal Centre) are for informational purposes only and should not be construed as investment advice by you. Such technical analysis are believed to be obtained from sources believed to be reliable, but not warrant their respective completeness or accuracy, or warrant any results from the use of the information. Your use of the technical analysis , as would also your use of any and all mentioned indicators, strategies, columns, articles and all other features, is entirely at your own risk and it is your sole responsibility to evaluate the accuracy, completeness and usefulness (including suitability) of the information. You should assess the risk of any trade with your financial adviser and make your own independent decision(s) regarding any tradable products which may be the subject matter of the technical analysis or any of the said indicators, strategies, columns, articles and all other features.
Please also be reminded that if despite the above, any of the said technical analysis (or any of the said indicators, strategies, columns, articles and other features accessible on/through this site) is found to be advisory or a recommendation; and not merely informational in nature, the same is in any event provided with the intention of being for general circulation and availability only. As such it is not intended to and does not form part of any offer or recommendation directed at you specifically, or have any regard to the investment objectives, financial situation or needs of yourself or any other specific person. Before committing to a trade or investment therefore, please seek advice from a financial or other professional adviser regarding the suitability of the product for you and (where available) read the relevant product offer/description documents, including the risk disclosures. If you do not wish to seek such financial advice, please still exercise your mind and consider carefully whether the product is suitable for you because you alone remain responsible for your trading – both gains and losses.

Carrefour (CA.pa) bearish scenario:The technical figure Rising Wedge can be found in the French company Carrefour (CA.pa) at daily chart. Carrefour is a French multinational retail corporation headquartered in Massy, France. The eighth-largest retailer in the world by revenue, it operates a chain of hypermarkets, groceries stores, and convenience stores, which as of January 2021, comprises its 12,225 stores in over 30 countries. The Rising Wedge has broken through the support line on 21/05/2022, if the price holds below this level you can have a possible bearish price movement with a forecast for the next 17 days towards 17.880 EUR. Your stop loss order according to experts should be placed at 21.370 EUR if you decide to enter this position.
Europe's largest food retailer reported first-quarter sales that showed a lacklustre performance in its core French market, overshadowing more robust growth in Brazil.
The French retailer said it was confident about its 2022 outlook, confirming a key cash flow target for the year, but this was not enough to support the shares following a 26% rise so far this year. Cash is key to Carrefour's plans to step up digital commerce expansion without the extra financial resources that would have been on hand if two planned tie-ups last year had not failed - one with Canada's Couche-Tard and the other with France's Auchan.
Risk Disclosure: Trading Foreign Exchange (Forex) and Contracts of Difference (CFD's) carries a high level of risk. By registering and signing up, any client affirms their understanding of their own personal accountability for all transactions performed within their account and recognizes the risks associated with trading on such markets and on such sites. Furthermore, one understands that the company carries zero influence over transactions, markets, and trading signals, therefore, cannot be held liable nor guarantee any profits or losses.

Carrefour (CA.pa) bearish scenario:The technical figure Triangle can be found in the French company Carrefour (CA.pa) at daily chart . Carrefour is a French multinational retail corporation headquartered in Massy, France. The eighth-largest retailer in the world by revenue, it operates a chain of hypermarkets, groceries stores, and convenience stores, which as of January 2021, comprises its 12,225 stores in over 30 countries. The Triangle has broken through the support line on 08/03/2022, if the price holds below this level you can have a possible bearish price movement with a forecast for the next 22 days towards 15.755 EUR. Your stop loss order according to experts should be placed at 18.310 EUR if you decide to enter this position.
Carrefour it was confident about its turnaround after Europe's largest food retailer delivered record free cash flow of 1.23 billion euros ($1.40 billion) and a 7.7% rise in operating profit for 2021. On the back of these strong results Carrefour handed investors an 8% dividend hike to 0.52 euros per share and launched a new share buyback plan of 750 million euros for 2022. Cash is also key to the French food retailer's plans to step up digital commerce expansion without the extra financial resources that would have been on hand if two planned tie-ups last year had not failed - one with Canada's Couche-Tard and one with France's Auchan.
Risk Disclosure: Trading Foreign Exchange (Forex) and Contracts of Difference (CFD's) carries a high level of risk. By registering and signing up, any client affirms their understanding of their own personal accountability for all transactions performed within their account and recognizes the risks associated with trading on such markets and on such sites. Furthermore, one understands that the company carries zero influence over transactions, markets, and trading signals, therefore, cannot be held liable nor guarantee any profits or losses.

Carrefour: Bullish Flag PatternCarrefour - Short Term - We look to Buy a break of 18.15 (stop at 17.62)
Posted a bullish Flag formation. A break of 18.00 is needed to confirm the outlook. 20 1day EMA is at 17.30. The stock is expected to outperform in its sector. 17.50 continues to hold back the bears.
Our profit targets will be 19.99 and 21.10
Resistance: 18.50 / 20.00 / 22.00
Support: 17.50 / 17.00 / 16.50
Disclaimer – Saxo Bank Group. Please be reminded – you alone are responsible for your trading – both gains and losses. There is a very high degree of risk involved in trading. The technical analysis, like any and all indicators, strategies, columns, articles and other features accessible on/though this site (including those from Signal Centre) are for informational purposes only and should not be construed as investment advice by you. Such technical analysis are believed to be obtained from sources believed to be reliable, but not warrant their respective completeness or accuracy, or warrant any results from the use of the information. Your use of the technical analysis, as would also your use of any and all mentioned indicators, strategies, columns, articles and all other features, is entirely at your own risk and it is your sole responsibility to evaluate the accuracy, completeness and usefulness (including suitability) of the information. You should assess the risk of any trade with your financial adviser and make your own independent decision(s) regarding any tradable products which may be the subject matter of the technical analysis or any of the said indicators, strategies, columns, articles and all other features.
Please also be reminded that if despite the above, any of the said technical analysis (or any of the said indicators, strategies, columns, articles and other features accessible on/through this site) is found to be advisory or a recommendation; and not merely informational in nature, the same is in any event provided with the intention of being for general circulation and availability only. As such it is not intended to and does not form part of any offer or recommendation directed at you specifically, or have any regard to the investment objectives, financial situation or needs of yourself or any other specific person. Before committing to a trade or investment therefore, please seek advice from a financial or other professional adviser regarding the suitability of the product for you and (where available) read the relevant product offer/description documents, including the risk disclosures. If you do not wish to seek such financial advice, please still exercise your mind and consider carefully whether the product is suitable for you because you alone remain responsible for your trading – both gains and losses.

Carrefour SA (CA.pa) bullish scenario:The technical figure Triangle can be found in the French company Carrefour SA (CA.pa) at daily chart. Carrefour is a French multinational retail corporation headquartered in Massy, France. The eighth-largest retailer in the world by revenue, it operates a chain of hypermarkets, groceries, and convenience stores, which as of January 2021, comprises its 12,225 stores in over 30 countries. The Triangle has broken through the resistance line on 10/11/2021, if the price holds above this level you can have a possible bullish price movement with a forecast for the next 18 days towards 17.450 EUR. Your stop loss order according to experts should be placed at 14.915 EUR if you decide to enter this position.
Risk Disclosure: Trading Foreign Exchange (Forex) and Contracts of Difference (CFD's) carries a high level of risk. By registering and signing up, any client affirms their understanding of their own personal accountability for all transactions performed within their account and recognizes the risks associated with trading on such markets and on such sites. Furthermore, one understands that the company carries zero influence over transactions, markets, and trading signals, therefore, cannot be held liable nor guarantee any profits or losses.


Multi year breakoutPotential for long term bullish scenario
Downward trend since 2015 top was broken on weekly - hourly consolidation above broken trendline
Buy signal: hourly close above MA 50 / bullish impulse candle in consolidation zone

Carrefour: Time to Watch: France By Sun Storm Investment Research
A Profit & Solutions Strategy
Web: sunstorminvestment.tk
Disclaimer: I am not a financial advisor, so please do your own research before trading anything


Carrefour near to buy for long termTwo level for buy:
16.2 or 15.5
We broken a importent line who started from 2015.

CA Approaching Resistance, Potential Drop! CA is approaching our first resistance at 17.16 (horizontal overlap resistance, 61.8% fibonacci extension, 61.8% fiboancci retracement, descending channel's resistance) where a strong drop might occur pushing price down to our major support at 15.32 (horizontal overlap support, 61.8% fiboancci retracement).
Stochastic (21,5,3) is also approcaching resistance where we might see a corresponding drop in price.


LONG CARREFOURMy view:
price can go back to 20-23
the "new" ( 2 years now i think) is trying to change the company. they came out with a first profit raise under his management, mainly from other markets then france, which is a little bit disappointing (49% still come from the main market which is france)
www.reuters.com

CARREFOUR ACHATProbabilité d'investissement à long terme 40.000 en objectif tout est décrit dans le graphique
