It is not the best time to open a short position.But it's also not the best time to close it. The indicator RSI is in a state of extreme oversold. So I would not expect a protracted decline. Those who already holds a short position, I would advise to focus on the area of strong resistance and lower bounds of current trends.
CIS trade ideas

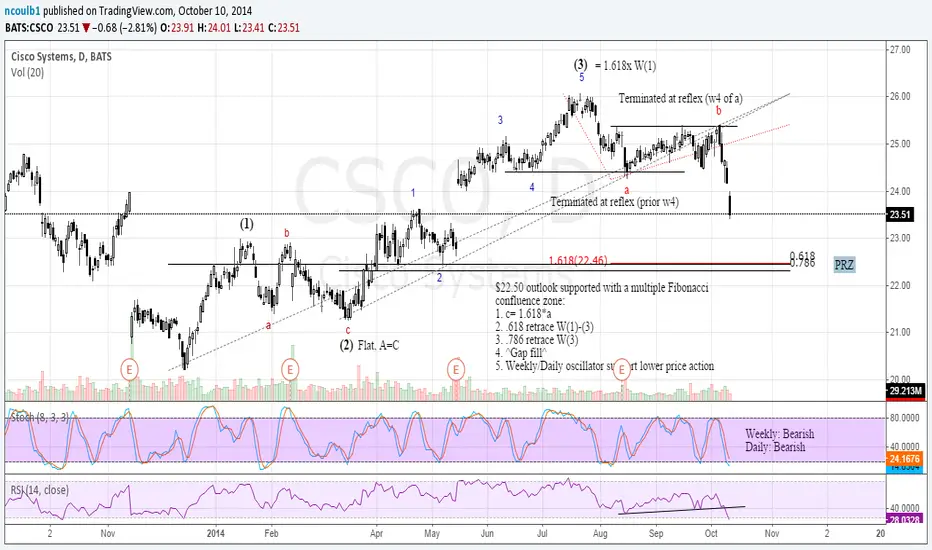
CSCO Head&ShouldersCisco is forming bearish reversal pattern with potential Right shoulder near $25.20. Previously, I was bullish on this stock (check my ideas in the links below) but sentiment is constantly changing and point to reduce risk was at $25.60 on 31 of July when upper-level base was broken.
Now, price broke down trend up and trading on its 100 EMA that acted like support in the mid of August.
Break and close below 100 EMA will trigger my SHORT entry with risk above $25.00. Also, I switch my bias from neutral to negative on overall market, as S&P looks broken (doesn't mean its short especially when oscillators are oversold below -75).

CSCO Price has retraced 50% of the downward impulse & is taking a break. Expect a Median Line tag at minimum.


CSCO easy long trade with trend, REVIEWCisco acts good after it built nice H&S pattern with series of higher lows and upper level consolidation which was broken on earnings with powerful gap up. then it took couple of days to absorb this big move, held and continued higher. Well-defined support at $24.40 and break up of triangle gave us another nice and calm trade as 8 EMA controlled and followed price nicely. Yesterday, it accelerated as we had good reports from Intel. Some kind of pullback and digestion makes sence. Other major cap tech companies also feels strong, $MSFT broke its consolidation with powerful, ignited, bull candle.
-------------------------------------------------------------------------------------------------------------------------------------------------------------
Check my thoughts about CSCO and other ideas in major cap tech stocks in the links below.
-------------------------------------------------------------------------------------------------------------------------------------------------------------

your lovely figerThis figure remined me your lovely one, on day the price far from 8 EMA so need a rest a little bit, so this figure on 15 min can go down, good price is 25,47 where is 50 EMA

The Tech Stock Trade: Cisco (NASDAQ:CSCO)Yesterday, Cisco (NASDAQ:CSCO) reported earnings. Cisco is one of those old tech stocks, like Yahoo (NASDAQ:YAHOO), Microsoft Corporation (NASDAQ:MSFT) and IBM (NYSE:IBM). One thing they all have in common is the possibility of going lower in the coming days. Also important to note is that the major indices, specifically the S&P500 (NYSEARCAPY), saw some selling after making a new high.
Now, CSCO (NASDAQ:CSCO) has gapped higher and the daily chart is showing a topping-tail on volume. This action on the daily chart is telling us that institutions are selling the stock.
As a technical trader I will play this on the short side after a retrace into the tail to minimize my risk .
Join us in the Elite Round Table to get our live trade alerts, when we enter and exit stocks for profit,step inside here.
www.inthemoneystocks.com
Kristof De Block
Elite Round Table, Pro Trader

CSCO inverse Head and Shoulders US markets (Dia, Spy) are trying to push to new highs. Money rotates to safe heaven, high dividend, large cap stocks (www.cnbc.com).
Cisco is component of both indexes DowJones and S&P. It built nice inverse Head and Shoulders pattern with neckline @ $23.60ish area. And we have series of three higher lows: first is bottom @ $20.22 then right shoulder with support @ 22.30ish and yeasterday it closed strong well off the lows, bounced from $22.50ish support of that nice upper-level base, regained 8 and 21 moving averages.
It would be healthy to see some construction above short term moving averages and continuation move to test neckline @ $23.60 with potential break up.
ENTER long here @ low $23.00ish with STOP below $22.43, first TARGET @23.60.
Macro target is $26.50-27.00, but till then i wll navigate that potential trend up with active approach.

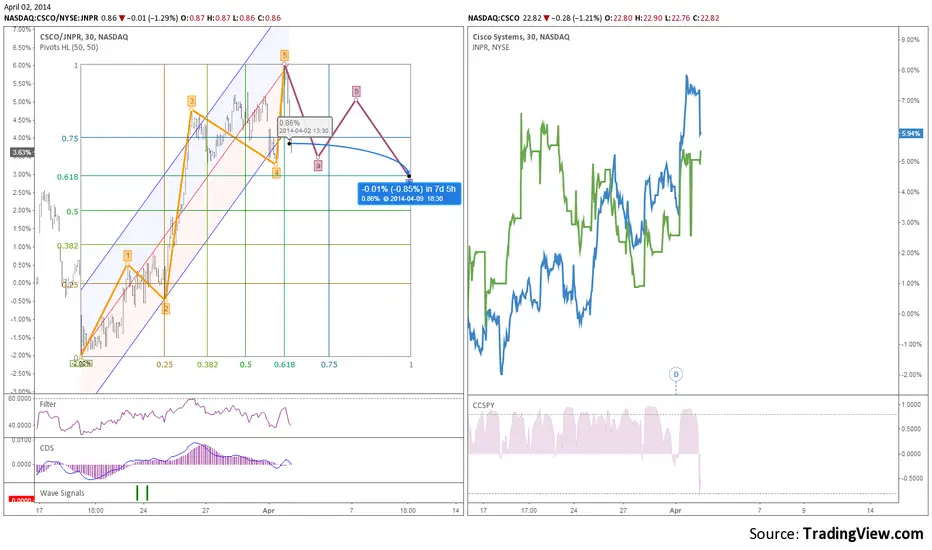
$JNPR or $CSCO? Which will perform better in the next 7 days?Pair Options Forecast: JNPR will outperform CSCO in the next 7 day
ANALYSIS: Cointegration, Correlation and Technical
Strategy: Elliot Wave Principle www.bitcoinprice.mobi
Trading pairs JNPR vs CSCO which has moved from its correlation can be done based on cointegration or technical analyzing the prices of the stock pairs and tries to profit from the mean-reversion proces.
Cointegration (right chart): look for the divergence pairs that have moved away from each other and then back together in a regular pattern:
1. Identify a gap.
2. Make a trade assuming the stocks will return to their correlated path
The strategy is therefore to identify when the “gap” is created and to trade in the assumption that there is a high probability the gap will close or narrow.
This pairs have a high positive correlation between them, meaning that both stocks historically tend to move together. Generally because they are from the same industry sector and traded in the same market, so the same factors impact them.
Technical Analysis of the spread (left chart):
Cisco move together very closely and has a maximal correlation with Juniper. This means it's profitable when the relative value between the two assets is perturbed from equilibrium, you can take a contrarian position and profit from the spread trading as the prices revert back to their long-run mean.
The trade should be opposite to the “gap”. CSCO has performed better than JNPR, in order to close the “gap” JNPR will now perform better.
Ciprian,
google.com
Cisco - Histogram divergencesCisco has a very nice pattern in price action with lower lows, followed by lowers highs. The start of 2014 broke this pattern, turning the pattern to higher high - higher low. Last month there was some indecision, price going sideways, drawing a double top, then rejected it at the neckline. Currently, Cisco restested the double top neckline, and rejected it again. This is a nice pattern, especially if it happens at a fib level, and if it comes with a divergence and a candlestick pattern, in this case bullish engulfing.
Let's take a closer look at the MACD histogram. I took the lines out so the patterns are more visible. I also changed the values, making it more sensitive so the divergences will be even more clear. I circled two identical patterns, first in september - october and the second january - march :
1) Bears come in very strongly
2) Bulls come in strongly
3) Bears come to power again, still strong, but weaker than the first time. We have a bullish divergence, but the bear power is still strong and the price doesn't go up so much.
4) Then bulls come in play again and them too are weaker this time, but this isn't important in the pattern.
5) Finally, for the third time bears come in play, with a very weak performance. The power between the bear power is obvious, hence the bullish divergence.
My stop is under the 61.8% fib retracement, around 21.20$ and my first target is at the previous high, near the round level of 23$. Risk/reward ratio is 3.
As I said on the chart, the weekly picture doesn't look good, so I preffer being cautious by taking a smaller position than usual.

CSCOSeems MFI reached its top, going to llook at Accum/Dist for confirmation, RSI already started going down with Stoch. I think this thing can pull back a bit. What do you all think?

Cisco catching the DowAfter a big gap down, Cisco is becoming interesting. Let's take a look at what happened last 6 months.
After a strong rally, the stock gapped down strongly in August, a sign that the big uptrend is over. At the 3rd wave bottom, which at the time i thought to be a C from an ABC correction we had a tripple bullish divergence, both on the MACD lines and histogram, indicating that there might be some up movement. There was up movement, till the earnings report dissapointed strongly. After the gap down following the bad Q3 earnings report, the stock stopped declining at the 20 psychological level, where we also had older support levels, forming what looks like a sharp bottom. Last 3 weeks, i can see some bullish activity.
Considering that Cisco was well correlated with the DOW Jones last years, I expect them to synchronize again, shorting the Dow now would be a bad thing to do, so the alternative is going long Cisco.
If we look at the way the stock moves, I mean the lower lows and lower highs, we notice that this high is exceeding the previous one made after there were some bulls buying after the Q3 earnings report.
The MACD has been giving us bullish signals a week ago, all details outlined on the chart.
IF and only IF we have a close over the blue weekly resistance line, I am going long, first two targets outlined on the chart. However, if we close over that level i expect the stock to go even higher than my targets, but it's a long road till there. First let's see 25 bucks per share


Anyone notice this mini positive divergence?Seems like a big boy closed the Dec 19 Ps for .02. And, Mar 22/24 call spread x8.3k I think is opened. The Jan 20 P seems to be STO as well x6k. Jan'15 $17 P x2.2k traded at bid .87... 75k calls vs 32k puts..


Possible divergence?Improving RSI. Biggest trade today was a STO of the Jan'16 $18 Ps. Monthly 21/22s active. Bullish article yesterday from Schaeffer's as well. Long some LEAPs already. On watch to add more. Link: www.schaeffersresearch.com


Cisco - Possible uptrend resumeCisco Systems has been in a strong uptrend for a long time, completing a five wave formation. Last months we can see an abc correction till the 38.2% fib, around the 200 day moving average.
If we look closely at the top (at wave 5), and look closely at the recent bottom (at wave c), we can see a perfect simetry, a double divergence.
Red lines represent strong support and resistance from the weekly charts. Close support is the blue line.
First target is at the 61.8% fib retracement from the top, and the second target is the actual top.
Remember, this trade is relative to the earnings report and the price action preceding it. If the report comes out good and there is no gap or strong bullish price action, i would be really reluctant toward this trade.
For now the trade is in stand by, waiting for confirmation

Cisco Potential Recovery AheadCisco shares breaking higher, as price may be heading to resume the overall long term bullish trend. After testing its main ascending trend line, price has broken a classic falling wedge bullish pattern, key horizontal resistance around 23.40, 23.40 is also a neckline for Adam and eve double bottom pattern. Targets and technical notes outlined on chart.

CSCOBullish divergence all over the map. But be aware of the gap fill target at 21.40. Trendline support area was participated by longs, but we do need to see it close above the down trend line. Earnings coming up in a few weeks, I would expect a run up to 23.68 then 25.96 after earnings comes out.

CSCOVol has been decreasing during minor UT. Eyes on FOMC. 200MA Rejection. Top of Falling Wedge. Remain bearish
