COMCAST shares continues to outperform Netflix and DisneyThe positive performance of Comcast's shares coincided with a buoyant stock market, as the S&P 500 Index and the Dow Jones Industrial Average closed at 4,358.24 and 33,739.30 respectively on Tuesday.
Despite trading volume for Comcast being reported at 15.4 million, below its 50-day average of 17.2 million, the company's stock outperformed several key competitors in the sector. Netflix Inc. (NASDAQ:NFLX), for instance, saw its shares drop by 3.27% to $373.32 on Tuesday.
Meanwhile, Charter Communications Inc.'s (NASDAQ:CHTR) stock rose by 0.52% to $444.72, matching Comcast's positive trajectory. However, Comcast slightly surpassed Walt Disney Co.'s (NYSE:NYSE:DIS) performance, which saw a lesser increase of 0.34% to close at $84.99.
The continued rise in Comcast's shares suggests that investors are responding positively to the company's recent performance and prospects, despite trading volumes being below average over the past week.
CTP2 trade ideas

$CMCA - Further downside possibleComcast has been rejected at overhead resistance around 47.26 with a gap to fill lower down at 43.47. Further targets to the downside are 34.20 and 30.17. Should the price continue higher, previous swing high of 61.79 would be level to look out for.

$CMCSA at a decision pointOnce again NASDAQ:CMCSA has reached a level of importance. If the stock can break and close above the $47 range with good volume, it should be a positive sign technically for the stock. In this economic environment, caution is a must.

$CMCSA with a bullish outlook following its earnings #StocksThe PEAD projected a bullish outlook for NASDAQ:CMCSA after a positive under reaction following its earnings release placing the stock in drift A with an expected accuracy of 62.5%.

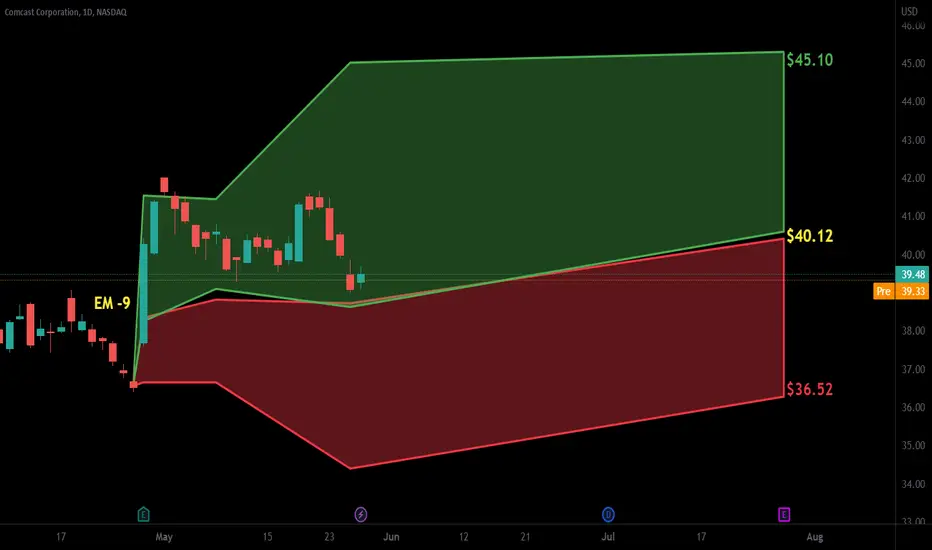
CMCSA Comcast Corporation Options Ahead of EarningsAnalyzing the options chain and the chart patterns of CMCSA Comcast Corporation prior to the earnings report this week,
I would consider purchasing the $45 strike price Calls with
an expiration date of 2023-8-18,
for a premium of approximately $0.47.
If these options prove to be profitable prior to the earnings release, I would sell at least half of them.
Looking forward to read your opinion about it.

COMCAST Hit our long-term target. Expecting a pull-back.It has been a worthwhile wait on our previous COMCAST (CMCSA) buy signal (see chart below) that we gave on April 28, but it finally hit the $44.00 target today:
The trend is unchanged within the Channel Up pattern since the October 13 2022 bottom, but as the 1D RSI turned extremely overbought (above 70.00), it gives a sell signal since every overbought break-out delivered a pull-back towards the 1D MA50 (blue trend-line) at least. The 1D MA50 is currently on the 0.382 Fibonacci retracement level (from the ATH) and moving parallel to the bottom (Higher Lows trend-line) of the Channel Up. We project the pull-back to be within 43.50-42.50. After that, our buy target will be Resistance 1 at 48.50.
-------------------------------------------------------------------------------
** Please LIKE 👍, FOLLOW ✅, SHARE 🙌 and COMMENT ✍ if you enjoy this idea! Also share your ideas and charts in the comments section below! **
-------------------------------------------------------------------------------
💸💸💸💸💸💸
👇 👇 👇 👇 👇 👇

CMCSA: Bullish WeeklyThis communication stock may play catch u [ to some of the overbought names.
Relative strength when the sector is down is very positive.

$CMCSA with a bullish outlook following its earnings #StocksThe PEAD projected a bullish outlook for NASDAQ:CMCSA after a positive under reaction following its earnings release placing the stock in drift A with an expected accuracy of 71.43%.
CMCSA - Angled Double BottomsThree angled double bottoms that are very similar.
All leading to bullish results.
Bars pattern shows my bullish thoughts.
A double bottom is considered a bullish pattern.

CMCSA DCA - Cup and HandleCompany: Comcast Corporation
Ticker: CMCSA
Exchange: NASDAQ
Sector: Communication Services
Introduction:
Greetings, and welcome to today's technical analysis. We're focusing on the daily chart of Comcast Corporation (CMCSA), highlighting a bullish reversal pattern known as a cup and handle that has formed over 294 days.
Cup and Handle Pattern:
The cup and handle pattern is often a bullish continuation or a bullish reversal signal and is characterized by a 'U' shape (the cup) followed by a smaller, downward drift (the handle). The formation is complete when the asset's price breaks above the resistance line marking the top of the handle.
Analysis:
Comcast Corporation's price was previously in a downtrend, denoted by the blue diagonal resistance line. This downward movement appears to have been interrupted by the cup and handle pattern. The horizontal resistance line of this pattern is located at $40.94, with the price currently having a second breakthrough.
Notably, the 200 EMA is above the price, suggesting a bullish market environment.
Upon a successful breakout, the projected price target is $53.50, offering a potential rise of 30.70%. Therefore, a long position might be considered.
Conclusion:
The daily chart of Comcast Corporation presents an interesting scenario, with the formation of a cup and handle pattern suggesting a potential bullish reversal. With the successful breakout above the pattern's resistance this presents an opportunity for a long position.
As always, please bear in mind this analysis does not constitute financial advice. It's vital to conduct your own research and consider risk management strategies when investing.
If you found this analysis insightful, please like, share, and follow for more updates. Happy trading!
Best regards,
Karim Subhieh

How to Trade Bearish Harami PatternsHow to trade bearish harami patterns with entries and stop levels.

Comcast Longuptrend off uptrend
upper Bollinger band
above 20 day moving average
weekly zones red/blk = supply & green/blk = demand
trend reversal on weekly confirmed at weekly demand zone

CMCSA Target $49A break out of a cup and handle pattern should see it test 0.618 Fib level.
Target 49

COMCAST eyeing an end-of-quarter 44.00 target.The Comcast Corporation (CMCSA) had a +10% jump yesterday, capitalizing on the higher than expected earnings and is approaching the February 02 High. The long-term pattern is a Channel Up (blue) but there might be a diverging Channel Up also emerging (dotted lines) that might decelerate this aggressive rise.
So far we see a tendency to fill the Lower Highs gaps of the Bear Cycle and the next ones (2 & 3) are within 43.85 - 44.70. As a result we set an end of quarter (Q2) target at 44.00.
-------------------------------------------------------------------------------
** Please LIKE 👍, FOLLOW ✅, SHARE 🙌 and COMMENT ✍ if you enjoy this idea! Also share your ideas and charts in the comments section below! **
-------------------------------------------------------------------------------
💸💸💸💸💸💸
👇 👇 👇 👇 👇 👇

CMCSA, 10d+/-14.30%falling cycle -14.3% more than 10 days.
==================================================================================================================================================================
This data is analyzed by robots. Analyze historical trends based on The Adam Theory of Markets (20 moving averages/60 moving averages/120 moving averages/240 moving averages) and estimate the trend in the next 10 days. The white line is the robot's expected price, and the upper and lower horizontal line stop loss and stop profit prices have no financial basis. The results are for reference only.

CMCSA Bearish AB=CDCMCSA Bearish AB=CD completed pattern now it may prepare for bearish divergence after making LH and LL

CMCSA - head and shoulders On the chart we can see that Comcast Corporation is creating a head and shoulders pattern.
We are waiting for the breakout of the neckline to take our short position.
Target and stop loss are shown on the chart.

CMCSA- lower for nowCMCSA has failed to hold -price over the point of control and has given a sell signal on the 4 hour time frame. The signal is good for approx $2. and is active for an average of 21 bars. Selling at the money calls for Feb regular / looking for $2+ to the downside

Comcast (CMCSA) bearish scenario:The technical figure Channel Up can be found in the daily chart in the US company Comcast Corporation (CMCSA). Comcast Corporation is the largest American multinational telecommunications conglomerate. It is the second-largest broadcasting and cable television company in the world by revenue (behind AT&T), the largest pay-TV company, the largest cable TV company and largest home Internet service provider in the United States, and the nation's third-largest home telephone service provider. It provides services to U.S. residential and commercial customers in 40 states and the District of Columbia. The Channel UP broke through the support line on 22/02/2023. If the price holds below this level, you can have a possible bearish price movement with a forecast for the next 23 days towards 34.83 USD. According to experts, your stop-loss order should be placed at 40.74 USD if you decide to enter this position.
Comcast Corp has cut its stake in BuzzFeed Inc by 8.5% since the end of January, cashing in on a rally in the shares of the digital media company on reports of a plan to partner with OpenAI, the artificial intelligence firm behind ChatGPT.
It has so far sold more than 11 million BuzzFeed shares since Jan. 30, reducing its stake to 15.5% from 24%. The sale fetched Comcast about $28 million, according to a Reuters calculation.
It sold roughly four million shares for an average price of around $2.90 apiece at the end of January, and most recently dumped another 500,000 shares for an average of $2.05 a share, filings by Comcast showed.
NBCUniversal, Comcast's entertainment unit, had invested $200 million in BuzzFeed in 2015 and injected another $200 million in 2016, valuing the company at around $1.7 billion.
Risk Disclosure: Trading Foreign Exchange (Forex) and Contracts of Difference (CFD's) carries a high level of risk. By registering and signing up, any client affirms their understanding of their own personal accountability for all transactions performed within their account and recognizes the risks associated with trading on such markets and on such sites. Furthermore, one understands that the company carries zero influence over transactions, markets, and trading signals, therefore, cannot be held liable nor guarantee any profits or losses.

CMCSA daily possible short opportunity THE CONSISTENT TRADES analyze CMCSA as a bearish /weak fundamental stock and therefore would be traded only in a short position.
CMCSA is in a rising wedge pattern which break could be bearish and fast. It enters into resistance from gapping down and fills most of that gap. If rejection continues and the price fall below the trend line, the short opportunity would occur after dropping below the blue dotted line.
Volume is neutral.
It is above all major MA which is bullish.
However, RSI and MACD have strong and powerful bearish divergences which indicate there is no more momentum in price moving up.
Overall: After the price reaches the resistance level and closes the gap, there is a high chance to retest major MA. Drop out of the pattern would indicate a massive short-selling opportunity. FGirst major support would be BigRed. However, if the price continues to consolidate on this level, without a big drop with a big volume, there could be a bull move, which we wouldn't play because it is bearish fundamental stock.

$CMCSA with a Bullish outlook following its earnings #Stocks The PEAD projected a Bullish outlook for $CMCSA after a Negative over reaction following its earnings release placing the stock in drift C with an expected accuracy of 25%.
$cmcsa will pull back?There is an uptrend for $cmcsa. I would wait a pull back to get in. My set up is as below.
Entry; $37.14
S/L; $36.84
TP1; $38.14
TP2; $39.61
Please always do your own search and analysis before you take any trade. Do not rely on anyone :)

CMCSA Hitting Resistance?Sensing that the overall market is turning down after trying to hold above the 200 day moving average, one stock I had considered purchasing at a lower price is Comcast. Entered into Feb 17 45-40 call credit spread @ 0.63. The opening price surge could quickly reverse as the 200 day moving average may be too much to overcome for many stocks.
