CTP2 trade ideas

Bullflag Breakout?Watching carefully here for CMCSA to breakout of a bullflag at all time highs. Great consolidation and we also see some bullish divergence on the RSI

$CMCSAThis retreated a bit today but still looks good for the rest of this week, let's see what happens. Strong market should help.


CMCSAReally like this chart. Nice base that formed for roughly a year. Good strength coming from Com Serv stocks lets see if it will continue.

COMCAST CORP. ANALYSIS📈 NASDAQ:CMCSA LONG H4
🛒Buy above = 50.40
🎯Target1 = 51.25
🎯Target2 = 51.78
🎯Target3 = 52.63
🛑Stop loss = 49.02
❌Cancel trade and open reverse trade = 49.02
🙈Recommended risk = 2-3%
📉 NASDAQ:CMCSA SHORT H4
🛒SELL BELOW = 49.02
🎯Target1 = 48.17
🎯Target2 = 47.65
🛑Stop loss = 50.40
❌Cancel trade and open reverse trade = 50.40
🙈Recommended risk = 1-2%


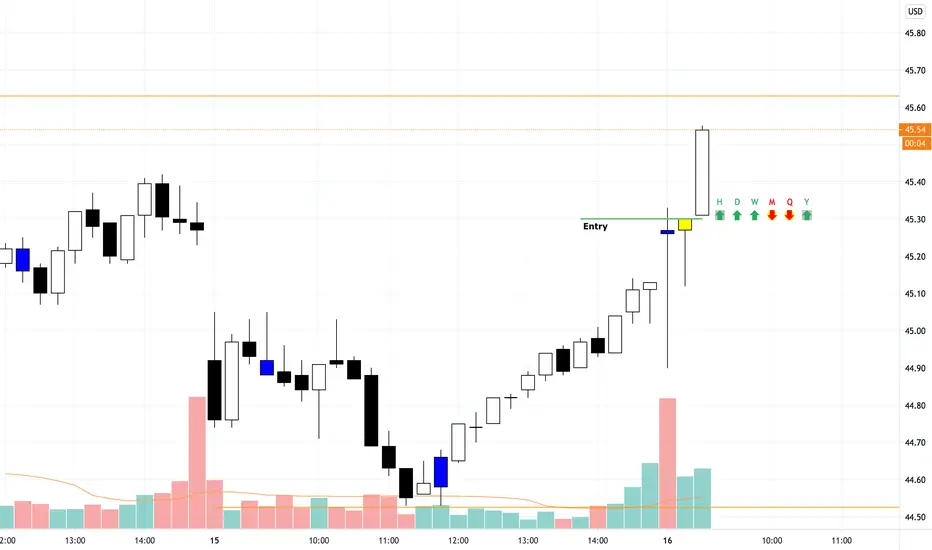
CMCSA 1D BIG 3 INDICATORBig Three Sub-Chart Indicator turned Green after the Day Candle Closed for an Entry Signal.
Big Three Sub-Chart Indicator shows a Long Entry Signal when the Sub-Chart Bar turned Green after the Day Candle Closed.
Big Three Indicator shows a Long Entry Signal when the Big 3 Indicator background turned Green after the Day Candle Closed
Entered Long Trade at Daily Candle Close.
Close Trade when Sub-ChartBar & Big 3 Indicator Line changes to Yellow or Red.


hour analysis for COMCAST HI FREINDS
this market will have a down trend i recommended that enter seller

CMCSA Triangle - Potential Breakout
Earnings on the 29th.
Volume is higher on the sell-off days than at the top.
Showing support at the 50 MA on the daily chart
About to test major resistance (all time highs) on the weekly chart of ~47.50
Possible long run to 47.50 at least, more if it can break.

CMCSA- The STRATHaven't been trading a lot due to time. And I have noticed that Fridays aren't a good trading day to me. I think I say to myself "look at all these cheap options!" then get a taste of why they are so. So today is Tight Stop Friday.
Here is one trade I'm currently in. 15 min, Chicago. Was looking for it to go short, hesitated, but glad I got in. Didn't like the option spread on this one but it worked out.
Also took a trade in SNAP.
CMCSA Swing trade IdeaGood buying activity, coupled with good earnings result. Currently trying to confirm the post earnings swing and the price action is looking good so far.

Saham Syarikat CMCSACMCSA
Comcast Corporation
Communication Services | Entertainment | USA
CMCSA adalah kod bagi syarikat Comcast Corp yang diperbuat dari segi sektor perkhidmatan.
Mengikut pemerhatian gelombang sahlun tentang saham ini adalah uptrend dalam tempoh 3 bulan lepas.
Dari segi kriteria syariah setakat hari ini, saham ini adalah TIDAK Patuh Syariah.
PENAFIAN: Maklumat dan penerangan sebarang senarai saham, derivatif, komoditi, matawang kripto, bon , sukuk atau sebagainya yang dinyatakan adalah sebagai tujuan pendidikan semata-mata dan bukanlah saranan pembelian mahupun penjualan. Segala liabiliti risiko dagangan adalah diatas tanggungan sendiri. Anda hendaklah mendapatkan rujukan dan nasihat dari pakar dan konsultan bertauliah.
www.sahlun.com


CMCSA pulling back to trend lineWatching this for a pull back to the trend line and about the $40 area

COMCAST CORP. LONG📈 LONG H4
🛒BUY above = 45.15
🎯Target1 = 45.91
🎯Target2 = 46.39
🎯Target3 = 47.15
🛑Stop loss or cancel trade = 43.90
🙈Risk = (1%-2%)
#CMCSA #CMCSALONG #CMCSABUY

daily analysis of COMCAST CORP Hi friends
the daily chart of this market shows with a high probability an uptrend in the coming days but it is better to be vigilant to change the direction of this market towards the opposite
please subscribe to receive new analyzes

$CMCSA - long expiration dateI think we will get $51 by 11/17. Got a super long expiration call option for very little moolah. Aiming for 152% on this one

