DYH trade ideas

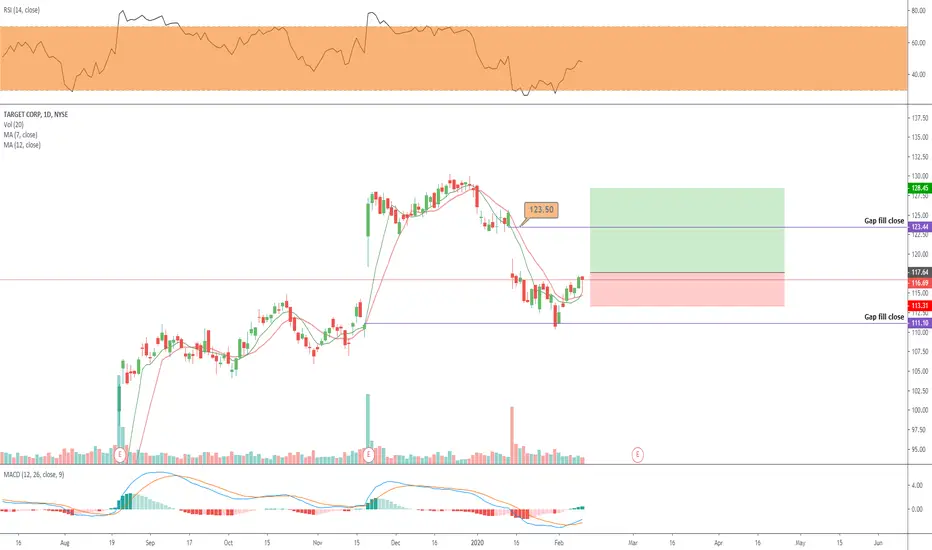
Target ready to challenge highs
Having retraced from overbought conditions , the stock looks ready to reverse.
RSI has reset and is moving higher.
MACD has crossed bullishly
Gap fill opportunity with $123.50 as the target.
Possible entry level $117.64
Target price $128.45
Stop loss $113.31
TARGET PRE EARNINGS RUN UP. Bullish trend, BreakoutI always love playing longs before earnings to get a free lotto on earnings.

$TGT Oversold Bounce to 122 then drop again to 105 or 90s Oversold indicators and Bounced from channel bottom (red color) suggested bounce to close recent gap at 122.5 then possible falling again to close lower gaps specially at 105 then at 90s which is about 1.6 fib from the top . if its break down red channel then will target 105 directly ..

Make the Move with Target this FebuaryTarget normally does really well around this time and the chart shows it. Past the redline is where you could put your stoploss or a bit further down.
Taking calls here would be decent, but over the green line is CONFIRMATION. Remember all lines of support and resistance are similar to rubber bands NOT metal rods. Trade carefully, NEVER be afraid to take the green.

$TGT - long, good risk/rewardNYSE:TGT - long for a bounce off the bottom trend line of bullish parallel channel

Target in Danger Currently in a critical situation having suffered a post earnings sell off.
The chart is full off gaps which exacerbate these moves.
A drop below the 100 Day Moving Average sub $100 could be on the cards.

TGT Symmetrical TriangleMACD looking good on 4 hr, higher lows, the last few candles based on close and wicks.
Trendline from August earnings at around $114 up here could offer support if it drops downwards.
RSI oversold.
Gap fill around $123 upside, around $114 downside with a secondary at around $111.
Need more data but A/D could be forming an uptrend.
Not advice.

TGT - Gaps to Fill Down - Earnings Miss - Trade Cautiously Waiting for confirmation break of white trendline to enter bearish.
Trade Entry
Will update with specifics once trend breaks.
Chart Details
Earnings miss on TGT caused gap down, almost filling top gap in chart.
Other large gaps down to $73.
Bearish EMA cross and bearish 10WeekMA price cross, but price still in “fakeout channel”.
Must confirm break of channel to indicate entry for downtrend.
About Me
2 WEEK FREE TRIAL MEMBERSHIP UNTIL 2/15/2020
www.moneypatterns.com
Options Strategies, Video Technical Analysis, Daily Updates, Subscription Memberships, Equities & Crypto, Weekly Breakdowns, Charting Service, & More in Members Area!
Thank you for liking, commenting, throwing up a chart, following, or viewing.
I am not a financial advisor. My comments and reviews are based on what I do with my personal accounts.
Website will be ready for launch mid-January 2020. Thank you for your patience while I try to juggle everything and maintain the same standards.
Disclosure - I am long BTCUSD, GBTC. Short term GDX Bullish, SPXS Bullish, SHAK Bullish, MCD Bullish, LEVI Bullish


$TGT | Monthly TF | Breakout Territoryrising wedges that break upwards in bull markets are hella bullish, dont fight the trend, use this to find good risk reward set-ups and remember the trend is your friend.


TGT: Parabolic mover! One more pop into 130's, then recalibrate.Very bullish ascending triangle on the monthly... seems to already be in position for LONG, but watch for break and hold above ~128.50.
I'll be keeping a close eye on this one going into next week!


TGT Quick FlipBought some puts at the rejection at the top here for a quick one day flip.
I don't expect this to tank, TGT is doing pretty well, just a quick flip.


$TGT Bull Flag in Target Long entry on break from bull flag @$128
upside target $137 and stop loss set @$126

TGT Platform Position TrendTGT has a Platform candlestick pattern which is a Position Trading style sideways price action. It is indicative of Dark Pool Quiet Accumulation that then triggers High Frequency Trader gaps. The resumption of another Platform candlestick pattern indicates the accumulation is not over.


TGT looking for BREAKOUTWaiting for TGT to break out and move upward, no position until we test more lows and highs of this triangle pattern.


