Ebay Wave Analysis – 24 July 2025
- Ebay broke round resistance level 80.00
- Likely to rise to resistance level 84.00
Ebay recently broke the round resistance level 80.00 (which stopped the previous intermediate impulse wave (5) at the start of June, as can be seen below).
The breakout of the resistance level 80.00 accelerated t
Next report date
—
Report period
—
EPS estimate
—
Revenue estimate
—
3.93 EUR
1.91 B EUR
9.99 B EUR
459.63 M
About eBay Inc.
Sector
Industry
CEO
Jamie Iannone
Website
Headquarters
San Jose
Founded
1995
FIGI
BBG000BPJ4M8
eBay, Inc. is a commerce company, whose platforms include an online marketplace and its localized counterparts, including off-platform businesses in South Korea, Japan, and Turkey, as well as eBay’s suite of mobile apps. It offers a platform for various product categories, including parts and accessories, collectibles, fashion, electronics, and home & garden. eBay generates revenue mainly through fees from sales, payment processing, and advertising. The company was founded by Pierre Morad Omidyar in September 1995 and is headquartered in San Jose, CA.
Related stocks

eBay Inc. (EBAY) Thrives on Niche Buyer DemandeBay Inc. (EBAY) is a global e-commerce marketplace connecting millions of buyers and sellers across a wide range of categories, from collectibles and electronics to fashion and home goods. Known for its auction-style listings and fixed-price options, eBay offers a flexible, user-driven shopping exp
Ebay Wave Analysis – 18 July 2025
- Ebay rising inside impulse wave (3)
- Likely to rise to resistance 80.00
Ebay continues to rise inside the impulse wave (3) of the long-term upward impulse wave 3 from the end of June.
The active long-term impulse wave 3 started earlier from the support zone between the support level 74.00, upp

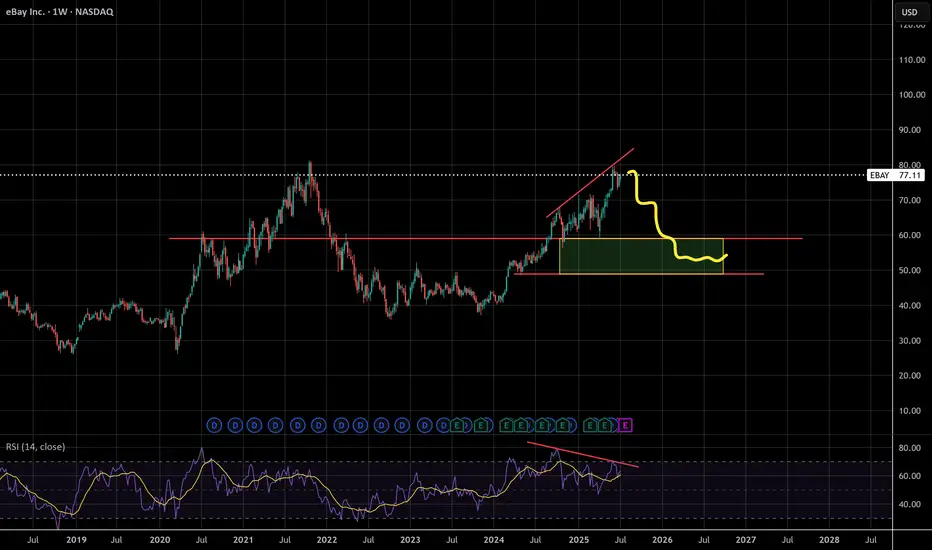
Ebay RSI flashing warnings - Handle forming?Looks like it may be forming a cup and handle, bearish divergence on the RSI
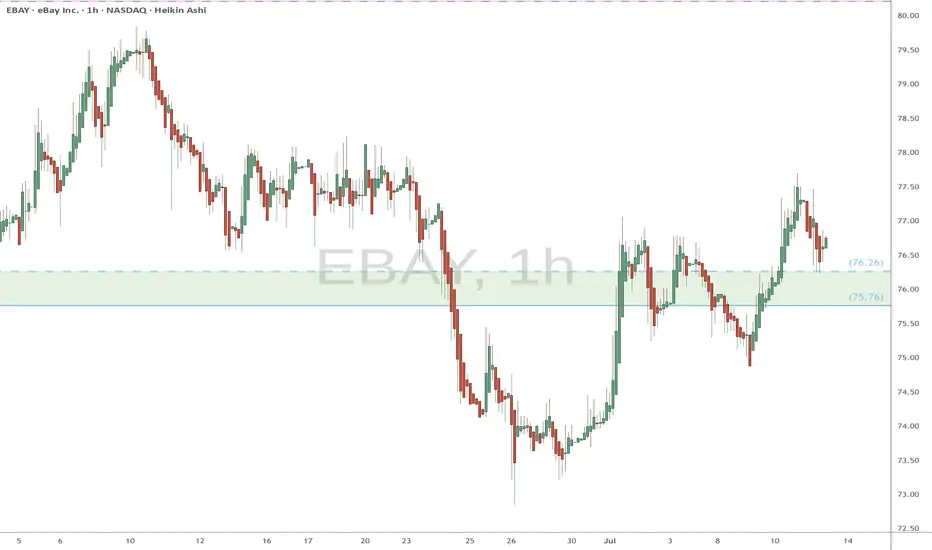
EBAY watch $75.76-76.26: Key Support zone to launch next Leg UP EBAY trying to get back above its ATH from 2021.
Now testing a key support zone at $75.76-76.26.
Good but late long entry with StopLoss just below.
.
See "Related Pubications" for previous charts such as THE BOTTOM call:
Hit the BOOST and FOLLOW for more PRECISE and TIMELY charts.
=============
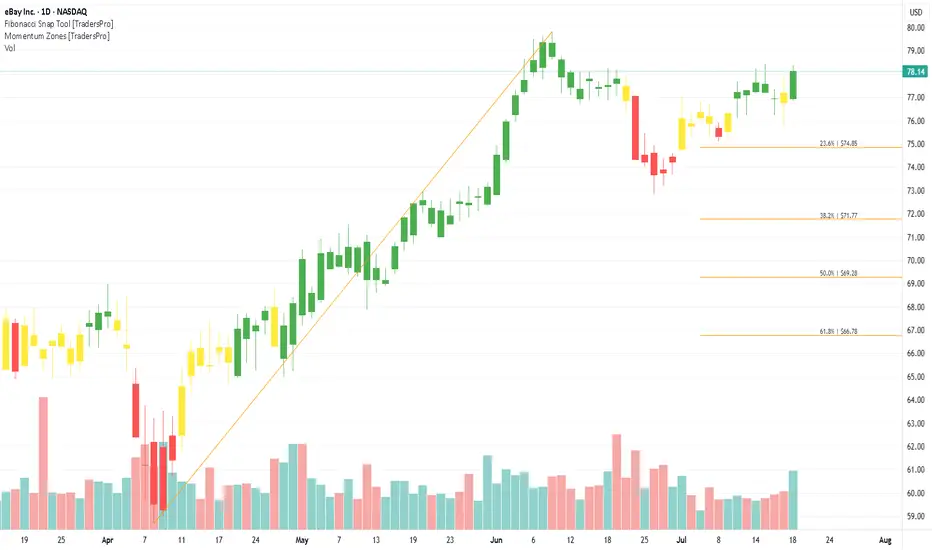
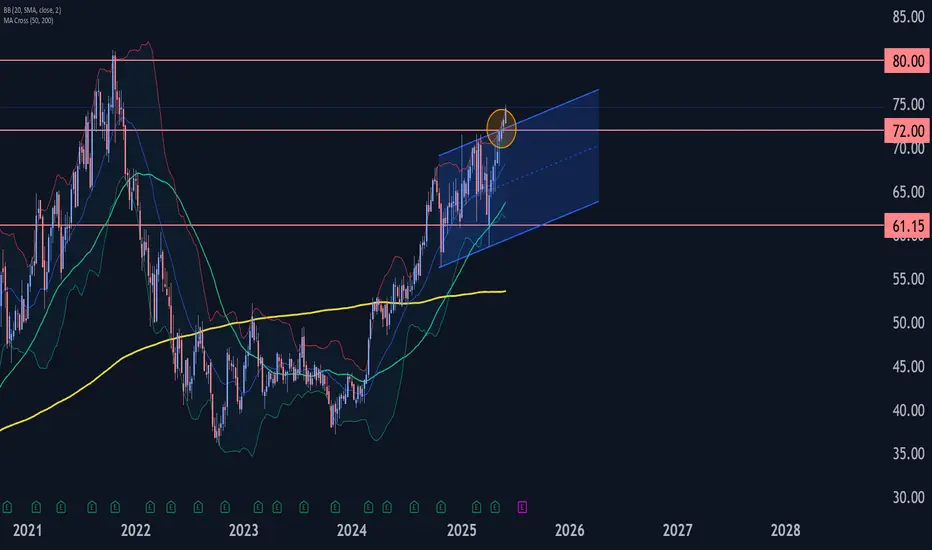
Ebay Wave Analysis – 24 June 2025
- Ebay reversed from long-term resistance level 80.00
- Likely to fall to support level 71.15
Ebay recently reversed down from the resistance area between the major long-term resistance level 80.00 (which started the weekly downtrend in 2021) and the upper weekly Bollinger Band.
The downward reve

EBAY on WatchWatching the pullback here.
Looking for an entry, but not going to try and catch a falling knife.
Why:
Strong uptrend
20EMA is aligning with .5 retracement
Could be low risk high reward depending on entry

ebay is on sale 🛒Hello TradingView Family / Fellow Traders. This is Richard, also known as theSignalyst.
📈 EBAY has exhibited an overall bullish trend , trading above the orange and blue trendlines.
At present, EBAY is undergoing a correction phase and it is currently approaching a strong support zone 30 - 34
🏹

EBAY heads up into $76: Major Resistance zone could mark a TOP EBAY has been relentlessly grinding away Northward.
About to test a serious resistance zone $75.76-76.26
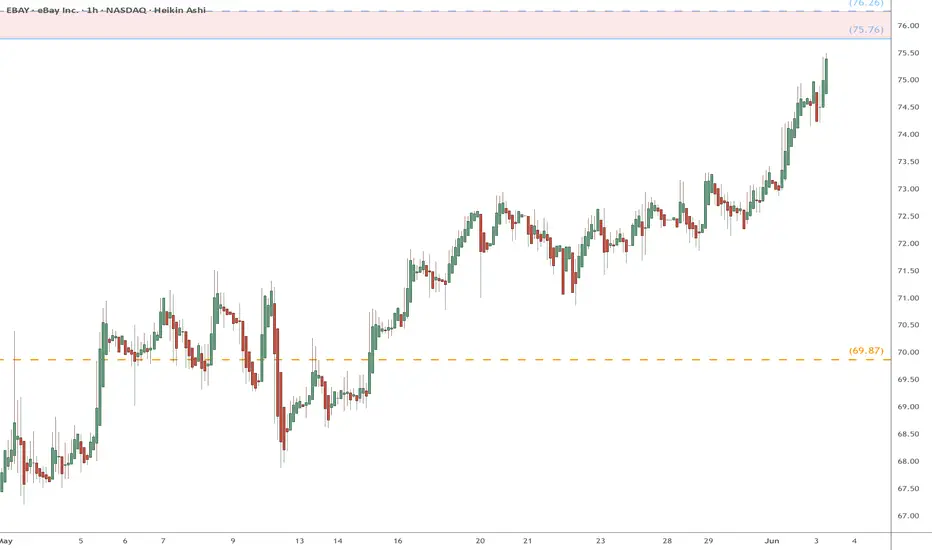
Expecting a dip to possibly the Golden Covid at $69.87
.
Previous Analysis that caught a HUGE breakout:
Ebay Wave Analysis – 2 June 2025
- Ebay broke resistance zone
- Likely to rise to resistance level 80.00
Ebay recently broke the resistance zone between the key resistance level 72.00 and the resistance trendline of the daily Up Channel from last year.
The breakout of this resistance zone accelerated the active weekly impulse wa
See all ideas
Summarizing what the indicators are suggesting.
Neutral
SellBuy
Strong sellStrong buy
Strong sellSellNeutralBuyStrong buy
Neutral
SellBuy
Strong sellStrong buy
Strong sellSellNeutralBuyStrong buy
Neutral
SellBuy
Strong sellStrong buy
Strong sellSellNeutralBuyStrong buy
An aggregate view of professional's ratings.
Neutral
SellBuy
Strong sellStrong buy
Strong sellSellNeutralBuyStrong buy
Neutral
SellBuy
Strong sellStrong buy
Strong sellSellNeutralBuyStrong buy
Neutral
SellBuy
Strong sellStrong buy
Strong sellSellNeutralBuyStrong buy
Displays a symbol's price movements over previous years to identify recurring trends.
US278642AZ6
EBAY 21/51Yield to maturity
6.70%
Maturity date
May 10, 2051
US278642AF0
EBAY 12/42Yield to maturity
6.42%
Maturity date
Jul 15, 2042
EBAY5500359
eBay Inc. 5.9% 22-NOV-2025Yield to maturity
5.23%
Maturity date
Nov 22, 2025
EBAY5178907
eBay Inc. 2.6% 10-MAY-2031Yield to maturity
4.93%
Maturity date
May 10, 2031
EBAY5500361
eBay Inc. 6.3% 22-NOV-2032Yield to maturity
4.79%
Maturity date
Nov 22, 2032
US278642AX1
EBAY 21/26Yield to maturity
4.73%
Maturity date
May 10, 2026
EBAY4962298
eBay Inc. 2.7% 11-MAR-2030Yield to maturity
4.69%
Maturity date
Mar 11, 2030
US278642AU7
EBAY 17/27Yield to maturity
4.35%
Maturity date
Jun 5, 2027
EBAY5500360
eBay Inc. 5.95% 22-NOV-2027Yield to maturity
4.33%
Maturity date
Nov 22, 2027
See all EBA bonds
Curated watchlists where EBA is featured.


Frequently Asked Questions
The current price of EBA is 70.03 EUR — it has decreased by −0.47% in the past 24 hours. Watch EBAY INC. DL-,001 stock price performance more closely on the chart.
Depending on the exchange, the stock ticker may vary. For instance, on FWB exchange EBAY INC. DL-,001 stocks are traded under the ticker EBA.
EBA stock has risen by 6.09% compared to the previous week, the month change is a 9.64% rise, over the last year EBAY INC. DL-,001 has showed a 41.62% increase.
We've gathered analysts' opinions on EBAY INC. DL-,001 future price: according to them, EBA price has a max estimate of 76.60 EUR and a min estimate of 42.56 EUR. Watch EBA chart and read a more detailed EBAY INC. DL-,001 stock forecast: see what analysts think of EBAY INC. DL-,001 and suggest that you do with its stocks.
EBA stock is 0.47% volatile and has beta coefficient of 0.45. Track EBAY INC. DL-,001 stock price on the chart and check out the list of the most volatile stocks — is EBAY INC. DL-,001 there?
Today EBAY INC. DL-,001 has the market capitalization of 31.96 B, it has increased by 0.19% over the last week.
Yes, you can track EBAY INC. DL-,001 financials in yearly and quarterly reports right on TradingView.
EBAY INC. DL-,001 is going to release the next earnings report on Jul 30, 2025. Keep track of upcoming events with our Earnings Calendar.
EBA earnings for the last quarter are 1.28 EUR per share, whereas the estimation was 1.24 EUR resulting in a 3.14% surprise. The estimated earnings for the next quarter are 1.10 EUR per share. See more details about EBAY INC. DL-,001 earnings.
EBAY INC. DL-,001 revenue for the last quarter amounts to 2.39 B EUR, despite the estimated figure of 2.35 B EUR. In the next quarter, revenue is expected to reach 2.24 B EUR.
EBA net income for the last quarter is 464.94 M EUR, while the quarter before that showed 655.90 M EUR of net income which accounts for −29.11% change. Track more EBAY INC. DL-,001 financial stats to get the full picture.
Yes, EBA dividends are paid quarterly. The last dividend per share was 0.26 EUR. As of today, Dividend Yield (TTM)% is 1.38%. Tracking EBAY INC. DL-,001 dividends might help you take more informed decisions.
EBAY INC. DL-,001 dividend yield was 1.74% in 2024, and payout ratio reached 27.40%. The year before the numbers were 2.29% and 19.26% correspondingly. See high-dividend stocks and find more opportunities for your portfolio.
As of Jul 26, 2025, the company has 11.5 K employees. See our rating of the largest employees — is EBAY INC. DL-,001 on this list?
EBITDA measures a company's operating performance, its growth signifies an improvement in the efficiency of a company. EBAY INC. DL-,001 EBITDA is 2.65 B EUR, and current EBITDA margin is 25.64%. See more stats in EBAY INC. DL-,001 financial statements.
Like other stocks, EBA shares are traded on stock exchanges, e.g. Nasdaq, Nyse, Euronext, and the easiest way to buy them is through an online stock broker. To do this, you need to open an account and follow a broker's procedures, then start trading. You can trade EBAY INC. DL-,001 stock right from TradingView charts — choose your broker and connect to your account.
Investing in stocks requires a comprehensive research: you should carefully study all the available data, e.g. company's financials, related news, and its technical analysis. So EBAY INC. DL-,001 technincal analysis shows the buy rating today, and its 1 week rating is strong buy. Since market conditions are prone to changes, it's worth looking a bit further into the future — according to the 1 month rating EBAY INC. DL-,001 stock shows the strong buy signal. See more of EBAY INC. DL-,001 technicals for a more comprehensive analysis.
If you're still not sure, try looking for inspiration in our curated watchlists.
If you're still not sure, try looking for inspiration in our curated watchlists.