FCEL UpdateRemember a while back I said all speculative money losing stocks will do a slow decay and eventually wind up at book value? I posted BLDP and FCEL stock back then....
So here we are, tangible book value $646M, market cap now $880M. Looks like it's headed under $2.
No position, just wanted to say I was right, lol. Unfortunately this one is too hard to predict on a day by day basis, so I didn't trade it much.
FEY trade ideas


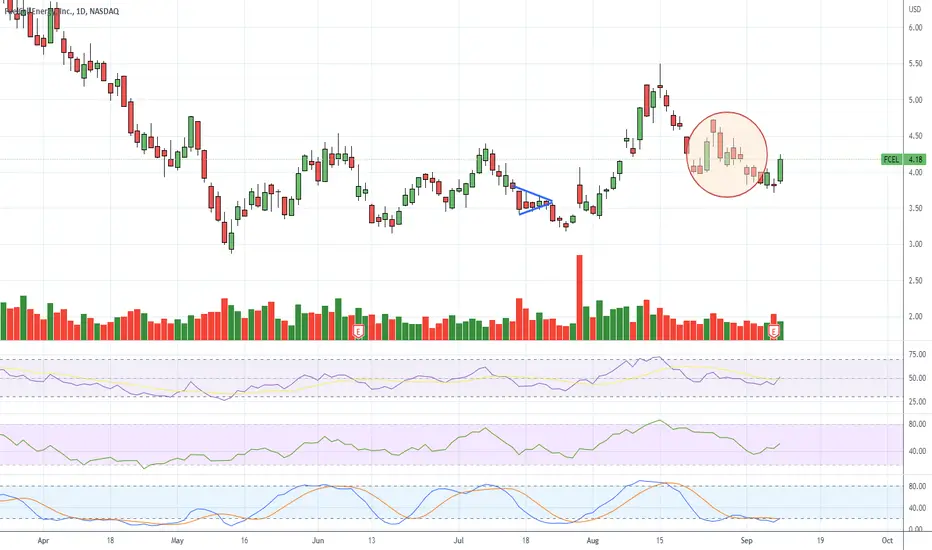
$FCEL fuel cellFCEL targets posted
Quad bull div on weekly macd
bull div on RSI (weekly)
Broke out of trendline + backtest

Buying FCELI am buying FCEL here.
FuelCell Energy, Inc., together with its subsidiaries, manufactures and sells stationary fuel cell energy platforms that decarbonize power and produce hydrogen.
Revenue is forecast to grow 24.21% per year
Currently unprofitable and not forecast to become profitable over the next 3 years

FCEL: Squeeze CandidateWhen a stock has a parabolic move, the pullback tends to be unrelenting but nevertheless organized in a way that presents regular squeeze opportunities. The pullback can lead to an "echo" pop (sometimes before the stock eventually disappears altogether) - or even new all-time highs down the line. It is a pattern to watch for. GME had a similar pattern in 2021 on the hourly chart.
The decline will initially hold the most aggressive moving average, with multiple tests along the way. Then at some point the frequency of the tests will increase or a consolidation just below it will occur where upon the pop will come. A necessary second close above that line will show whether the move has some legs. Often the first test of any strong MA trend, as discussed here, will fail on the second period candle - which presents a good short opportunity with an obvious stop.
The decline may resume but the force of the first moving average will waver and the next moving average will characterize the active resistance level. More tests of this second MA will ensue in a similar way to the first, with the familiar omens suggesting the approaching timing of a pop, like the first. Consolidations between moving averages like the one on GME (between the 20 and 50) are particularly good because they present a clear breakout level or pattern failure. Similarly, when price trades in an organized range directly below or directly above the relevant MA, then that is also a good tell that the stock is being accumulated for manipulation higher. The relevant consolidation will look atypical to the previous tests of the MA, because it obviously won't be rejected in the way as previously shown by that level (i.e. such as trapping one period candles noted earlier).
FCEL's decline has consistent characteristics to this organized pattern and looks ready for a pop. It is also notable for its similar long-term pattern. First level of interest is close however at 4.10. But then the levels to open up to 4.8, 5.8, and 13-14 for the immediate time horizon.


FCELWell I said things weren't gonna end well for FCEL, it's now back to preCOVID levels despite having shored up the balance sheet by selling shares on the stupid pump. AT least they did that right, so they can stay in business a few more years.
This appears to be a dead trade at this point

Fading into FCEL bear flag.FuelCell Energy - 30d expiry - We look to Sell a break of 2.79 (stop at 3.01)
The primary trend remains bearish.
Price action is forming a bearish flag which has a bias to break to the downside.
A break of the recent low at 2.86 should result in a further move lower.
Our outlook is bearish.
There is no clear indication that the downward move is coming to an end.
Our profit targets will be 2.24 and 2.14
Resistance: 3.25 / 3.40 / 3.80
Support: 3.00 / 2.77 / 2.50
Disclaimer – Saxo Bank Group.
Please be reminded – you alone are responsible for your trading – both gains and losses. There is a very high degree of risk involved in trading. The technical analysis , like any and all indicators, strategies, columns, articles and other features accessible on/though this site (including those from Signal Centre) are for informational purposes only and should not be construed as investment advice by you. Such technical analysis are believed to be obtained from sources believed to be reliable, but not warrant their respective completeness or accuracy, or warrant any results from the use of the information. Your use of the technical analysis , as would also your use of any and all mentioned indicators, strategies, columns, articles and all other features, is entirely at your own risk and it is your sole responsibility to evaluate the accuracy, completeness and usefulness (including suitability) of the information. You should assess the risk of any trade with your financial adviser and make your own independent decision(s) regarding any tradable products which may be the subject matter of the technical analysis or any of the said indicators, strategies, columns, articles and all other features.
Please also be reminded that if despite the above, any of the said technical analysis (or any of the said indicators, strategies, columns, articles and other features accessible on/through this site) is found to be advisory or a recommendation; and not merely informational in nature, the same is in any event provided with the intention of being for general circulation and availability only. As such it is not intended to and does not form part of any offer or recommendation directed at you specifically, or have any regard to the investment objectives, financial situation or needs of yourself or any other specific person. Before committing to a trade or investment therefore, please seek advice from a financial or other professional adviser regarding the suitability of the product for you and (where available) read the relevant product offer/description documents, including the risk disclosures. If you do not wish to seek such financial advice, please still exercise your mind and consider carefully whether the product is suitable for you because you alone remain responsible for your trading – both gains and losses.

FCEL | LongNASDAQ:FCEL
I expect rejection to the buy area; if it hits 3.75$ as my bullish signal, I hope it beats my target prices.
Possible Scenario: Long
Evidence: Price Action
TP1: 4.03$
tp2:4.33$

FCEL 7/11/2022FCEL
Running out of energy
FCEL Daily chart analysis.
This one has been in a downtrend for quite some time.
Price reached low of 3.00
Price bounced but ran into Resistance at 4.35 and the 50ema is also acting as Dynamic Resistance.
Price has currently pulled back to both the Resistance levels mentioned above. At the pullback, we have a Bearish price rejection at resistance.
The Stochastic is currently Overbought
Again, it doesn’t get old
Downtrend + Pullback to resistance + Overbought Stochastic = Short trade entry
Entering trade short
Entry: 4.03
Stoploss: 4.60(-14.14%)
Target: 3.00, +25.56%, 1.81 RR ratio

Selling FCEL 50% pullback.FuelCell Energy - Intraday - We look to Sell at 4.33 (stop at 4.61)
Price action continued to range between key support & resistance (3.15 - 4.40) and we expect this to continue.
Daily signals are bearish.
Preferred trade is to sell into rallies.
Levels close to the 50% pullback level of 4.34 found sellers.
4.39 has been pivotal.
Our profit targets will be 3.61 and 3.21
Resistance: 3.80 / 4.00 / 4.40
Support: 3.25 / 3.15 / 3.00
Disclaimer – Saxo Bank Group. Please be reminded – you alone are responsible for your trading – both gains and losses. There is a very high degree of risk involved in trading. The technical analysis , like any and all indicators, strategies, columns, articles and other features accessible on/though this site (including those from Signal Centre) are for informational purposes only and should not be construed as investment advice by you. Such technical analysis are believed to be obtained from sources believed to be reliable, but not warrant their respective completeness or accuracy, or warrant any results from the use of the information. Your use of the technical analysis , as would also your use of any and all mentioned indicators, strategies, columns, articles and all other features, is entirely at your own risk and it is your sole responsibility to evaluate the accuracy, completeness and usefulness (including suitability) of the information. You should assess the risk of any trade with your financial adviser and make your own independent decision(s) regarding any tradable products which may be the subject matter of the technical analysis or any of the said indicators, strategies, columns, articles and all other features.
Please also be reminded that if despite the above, any of the said technical analysis (or any of the said indicators, strategies, columns, articles and other features accessible on/through this site) is found to be advisory or a recommendation; and not merely informational in nature, the same is in any event provided with the intention of being for general circulation and availability only. As such it is not intended to and does not form part of any offer or recommendation directed at you specifically, or have any regard to the investment objectives, financial situation or needs of yourself or any other specific person. Before committing to a trade or investment therefore, please seek advice from a financial or other professional adviser regarding the suitability of the product for you and (where available) read the relevant product offer/description documents, including the risk disclosures. If you do not wish to seek such financial advice, please still exercise your mind and consider carefully whether the product is suitable for you because you alone remain responsible for your trading – both gains and losses.

are we going lower or moving higherlower or higher from there , make your bets guys ... some of these hydrogen industries stocks are down a lot , would you buy the dip ?

FCEL UpdateThe more revenue they make the more money they lose, lol. But the market has to squeeze the shorts, not to mention get the gap fill after crap earnings like it always does.
Pattern looks familiar, if it gaps up big Monday then I'm fading the gap on this garbage. Fuel cell is cool technology, but nobody has made any money off of it.
Stock update$FCEL #FCEL Haven't looked at this one in a while until I was just asked about it.
I like the falling wedge monthly setup. Continues to have higher lows over the last 3 years.

FCEL - Breakout of descending wedgeI like the look at FCEL here.
It appears to have broken out of a descending wedge, retested the wedge trendline and appears primed to pump. It's also sat nicely on top of the 100MA which should provide support.
For this reason, I'm long here with a tight stop at $3.90.
I have a crazy-high target of $49 based on the falling wedge breakout, but in reality would be looking to sell in stages on the way up.

FCEL? More like FBUY!FuelCell Energy
Short Term
We look to Buy at 4.29 (stop at 3.84)
Previous resistance at 4.40 now becomes support. A higher correction is expected. We therefore, prefer to fade into the dip with a tight stop in anticipation of a move back higher. Buying pressure dominated price action yesterday and we expect this to continue today.
Our profit targets will be 5.79 and 6.28
Resistance: 5.90 / 6.94 / 11.55
Support: 4.40 / 3.20 / 3.00
Disclaimer – Saxo Bank Group. Please be reminded – you alone are responsible for your trading – both gains and losses. There is a very high degree of risk involved in trading. The technical analysis, like any and all indicators, strategies, columns, articles and other features accessible on/though this site (including those from Signal Centre) are for informational purposes only and should not be construed as investment advice by you. Such technical analysis are believed to be obtained from sources believed to be reliable, but not warrant their respective completeness or accuracy, or warrant any results from the use of the information. Your use of the technical analysis, as would also your use of any and all mentioned indicators, strategies, columns, articles and all other features, is entirely at your own risk and it is your sole responsibility to evaluate the accuracy, completeness and usefulness (including suitability) of the information. You should assess the risk of any trade with your financial adviser and make your own independent decision(s) regarding any tradable products which may be the subject matter of the technical analysis or any of the said indicators, strategies, columns, articles and all other features.
Please also be reminded that if despite the above, any of the said technical analysis (or any of the said indicators, strategies, columns, articles and other features accessible on/through this site) is found to be advisory or a recommendation; and not merely informational in nature, the same is in any event provided with the intention of being for general circulation and availability only. As such it is not intended to and does not form part of any offer or recommendation directed at you specifically, or have any regard to the investment objectives, financial situation or needs of yourself or any other specific person. Before committing to a trade or investment therefore, please seek advice from a financial or other professional adviser regarding the suitability of the product for you and (where available) read the relevant product offer/description documents, including the risk disclosures. If you do not wish to seek such financial advice, please still exercise your mind and consider carefully whether the product is suitable for you because you alone remain responsible for your trading – both gains and losses.

Ascending triangle on dailyHey traders, Its been a rough bear market and I have finally got back in.
There was a huge $369 billion climate bill announcement last week, which gave the clean energy sector a boost. FCEL, PLUG and ICLN etf.
Jan 2023 has over 73000 calls, while there are 18000 puts in OI.
Happy trading!

Greta says moon biden admin will take fcel to the next level, elon will need batteries when he gets to mars theyll surely use fuelcell energy, fell is the future, PT 150

FCELLONG-TERM: Holding inflection zone, falling wedge , hidden bullish divergence . (not financial advice)

Fuelling up for a bigger move? FuelCell Energy
Short Term
We look to Buy at 3.35 (stop at 3.04)
Previous support located at 3.35. A higher correction is expected. We therefore, prefer to fade into the dip with a tight stop in anticipation of a move back higher. Buying pressure dominated price action yesterday and we expect this to continue today.
Our profit targets will be 4.24 and 4.68
Resistance: 4.30 / 4.76 / 6.94
Support: 3.20 / 3.00 / 2.00
Disclaimer – Saxo Bank Group. Please be reminded – you alone are responsible for your trading – both gains and losses. There is a very high degree of risk involved in trading. The technical analysis, like any and all indicators, strategies, columns, articles and other features accessible on/though this site (including those from Signal Centre) are for informational purposes only and should not be construed as investment advice by you. Such technical analysis are believed to be obtained from sources believed to be reliable, but not warrant their respective completeness or accuracy, or warrant any results from the use of the information. Your use of the technical analysis, as would also your use of any and all mentioned indicators, strategies, columns, articles and all other features, is entirely at your own risk and it is your sole responsibility to evaluate the accuracy, completeness and usefulness (including suitability) of the information. You should assess the risk of any trade with your financial adviser and make your own independent decision(s) regarding any tradable products which may be the subject matter of the technical analysis or any of the said indicators, strategies, columns, articles and all other features.
Please also be reminded that if despite the above, any of the said technical analysis (or any of the said indicators, strategies, columns, articles and other features accessible on/through this site) is found to be advisory or a recommendation; and not merely informational in nature, the same is in any event provided with the intention of being for general circulation and availability only. As such it is not intended to and does not form part of any offer or recommendation directed at you specifically, or have any regard to the investment objectives, financial situation or needs of yourself or any other specific person. Before committing to a trade or investment therefore, please seek advice from a financial or other professional adviser regarding the suitability of the product for you and (where available) read the relevant product offer/description documents, including the risk disclosures. If you do not wish to seek such financial advice, please still exercise your mind and consider carefully whether the product is suitable for you because you alone remain responsible for your trading – both gains and losses.

FCEL UpdateThis is what I was saying earlier this morning, finally had the time to plot it.
Pennant forming and it's on a downtrend. Manchin killed the green bill, so no reason to pump alt energy companies

FCEL Short term playLooks to me like FCEL is setting up for a H&S pattern.
Doing a small long play here, target is $4. Funny that I'm long on a garbage stock

FCEL TRADING OPPORTUNITYUpward channel, Great place to get some strangles either call debit spreads with the same on the put side to lower risk but cap gains.
I except fcel to test the 200 ema around $5 whithin the coming weeks.
Options play is a strangle/straddle best used with debit spreads.
Price targets - $5+ and $3- if it breaks the $3 dollar mark we would most likely see $2. if it breaks above the 200 ema we might have a break out to take us above $6
