FCEL UpdateChart pattern was completely wrong, but in the end I was right about it heading to $3, lol. If only I saw the post Fed tank coming....
BLDP is now at $6, that has further to go. They've never made any money at all.
FEY trade ideas

FUELCELL ENERGY at major trend reversalStock seems to form a frustrating bottoming pattern over recent weeks/months. If so, we could see a target at around 60$ when it comes to CUP&HANDLE pattern.

FCEL 3/8/2022FCEL
Quite the ugly chart. Your typical “pump and dump” chart.
After moving side-ways for almost all of 2020, Price broke out Nov. ’20 and started its sharp uptrend pump
This pump took price from 3.50 and peaked at 29.40s in Feb. ‘21
Price then came crashing down to 11.54 where it found support.
Price went on to break down from this support and pulled back to it turning this previous support level into resistance. We also see a death cross during this period further signaling the bearish market
Price rejects this resistance level and was shot down to 6.00 where it found support and bounces back up. Price is now moving side-ways between 6.00-11.50
Price then fails to make higher high on the bounce. This leads to price breaking down from side-ways range it was in.
Price is now officially in downtrend.
Price has now pulled back in form of a bear flag to previous support level in 6.00 area and will look to turn it into resistance.
Price is currently at resistance level of bear flag, at previous support, and at 0.382 fib level. We are also in over-bought territory in stochastic. This is my que to enter trade
Entering trade short
Entry: 6.44
Stop Loss: 7.16
Target: 3.51 – +45%, 4.07 RR ratio

FuelCell to Break Lower? FuelCell Energy
Short Term - We look to Sell at 5.36 (stop at 5.86)
The primary trend remains bearish. A break of 5.50 is needed to confirm follow through negative momentum. Closed below the 50-day EMA. We look for losses to be extended today.
Our profit targets will be 3.69 and 3.12
Resistance: 7.00 / 8.00 / 11.50
Support: 5.50 / 3.50 / 2.50
Disclaimer – Saxo Bank Group. Please be reminded – you alone are responsible for your trading – both gains and losses. There is a very high degree of risk involved in trading. The technical analysis, like any and all indicators, strategies, columns, articles and other features accessible on/though this site (including those from Signal Centre) are for informational purposes only and should not be construed as investment advice by you. Such technical analysis are believed to be obtained from sources believed to be reliable, but not warrant their respective completeness or accuracy, or warrant any results from the use of the information. Your use of the technical analysis, as would also your use of any and all mentioned indicators, strategies, columns, articles and all other features, is entirely at your own risk and it is your sole responsibility to evaluate the accuracy, completeness and usefulness (including suitability) of the information. You should assess the risk of any trade with your financial adviser and make your own independent decision(s) regarding any tradable products which may be the subject matter of the technical analysis or any of the said indicators, strategies, columns, articles and all other features.
Please also be reminded that if despite the above, any of the said technical analysis (or any of the said indicators, strategies, columns, articles and other features accessible on/through this site) is found to be advisory or a recommendation; and not merely informational in nature, the same is in any event provided with the intention of being for general circulation and availability only. As such it is not intended to and does not form part of any offer or recommendation directed at you specifically, or have any regard to the investment objectives, financial situation or needs of yourself or any other specific person. Before committing to a trade or investment therefore, please seek advice from a financial or other professional adviser regarding the suitability of the product for you and (where available) read the relevant product offer/description documents, including the risk disclosures. If you do not wish to seek such financial advice, please still exercise your mind and consider carefully whether the product is suitable for you because you alone remain responsible for your trading – both gains and losses.

FCEL - Looking like a push to $8.50-$9 is comingTechnical Indicators + Oil Trends = FCEL Push to $8+?

FCEL Bull Flag BreakoutFCEL broke out of its bull flag pattern after forming an inverse head and shoulder pattern
I took a Long position at 6.18
Stop loss will be placed below the previous pivot low


FCEL 1/5/2022After a downtrend, price entered a distribution phase. Price broke down from support and pulled back in form of a bear flag. The bear flag has now also been broken.
There is also a Death cross indicating bear market conditions.
Entry: Pullback to 50ema or bottom of bear flag.
Stoploss: 6.05
Target: 3.25

FCEL UpdateOverlay of previous drop from $10, compensated for higher book value from cash gained by dilution while accounting for the increase in shares.
They really should've diluted their stock even more, lol. Much like AMC, the stupid runup allowed the company to stay in business for a little longer. So not everything about the bubble was bad.
Here's a decent write up, I have no position in this any more.
seekingalpha.com
FCEL UpdateForgot about earnings, lol. I told you guys a while back that this crap is headed back to $2... if not lower.
They've never made any money, they just dilute the stock to stay in business.

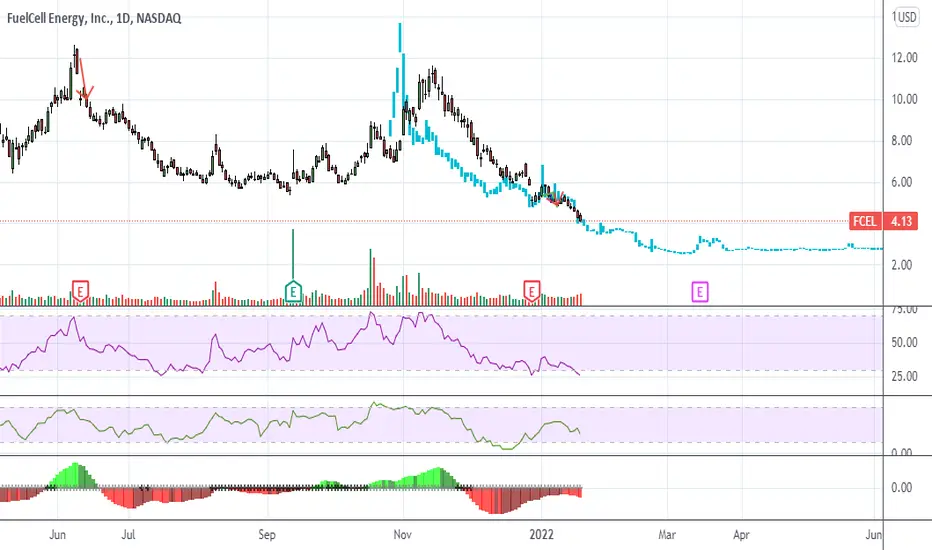
FCEL: FuelCell Energy Inc, Shrot1- CCI 20 is below 0. (Bearish )
2- Beak down the resistance. ( little bearish )
3- The red line is below the White line of “ACL” (self-made indicator) .( super Bearish ) (ADL indicator)
4- "Multi analyzer" (self-made indicator) is downtrend and is -4 right now. ( bearish )
5- Close is below the red and white line ( Bearish )
6- Mid-term channel (LR of 9months) is ascending (Bearish )
7- Long-term trend is sideway (sideway )
8- In bottom half of Mid-term channel ( bearish )
9- around middle of channel ( little bearish )
Overly , Bears are stronger
Buying is not suggested right now, 2$ may be a fair price! We should talk about it later.
Buying is also suggested after breaking the resistance around 5.95$
Short
SL: 5.8
TP1 : 2
TP2: depend on the setup (I will clarify later)
Beyond the technical: (do your analysis, I’m not educated in the case of fundamental analysis academically)
Fair Price to Intrinsic Value: 3.05
To summarize my fundamental opinion on this stock:
So bad ( a Super bearish)
In case of good stocks I prefer to be an investor not a trader, but trading with lower Trading with smaller amounts can increase the overall profitability without any unreasonable risk.

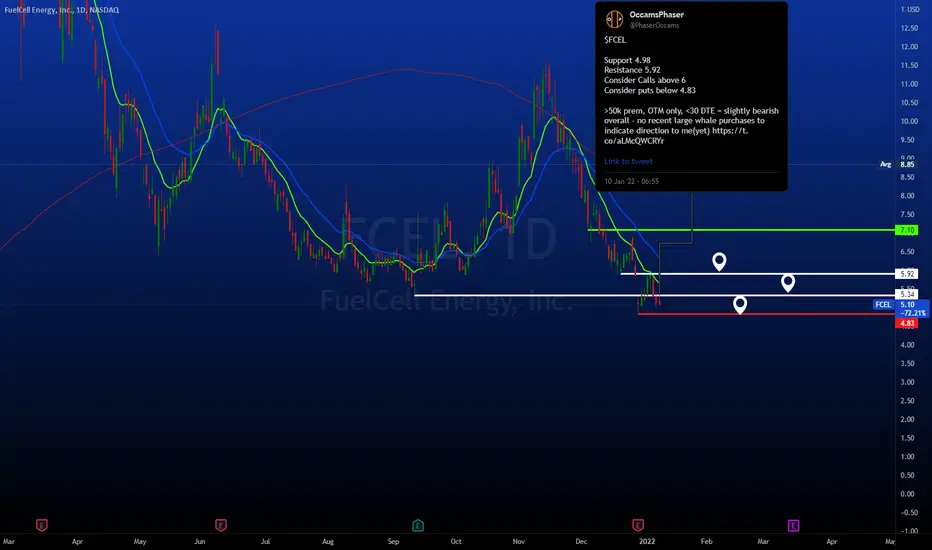
FCEL - levels to watch 1/10/22$FCEL
Support 4.98
Resistance 5.92
Consider Calls above 6
Consider puts below 4.83
>50k prem, OTM only, <30 DTE = slightly bearish overall - no recent large whale purchases to indicate direction to me(yet)
FCEL pennantI shorted this garbage yesterday with a $5.20 gap fill target which was hit on open this morning. Now it looks like it broke upwards out of the pennant and headed to $5.5 - $5.65, at which point I'm betting it scrolls down to the downward target of $4.9.
A lot of other garbage stocks have similar patterns and it looks like $NDX has an inverted H&S pattern going

$FCEL FCEL is looking very bullish and looking for a continuation ( this analysis is for stock option plays). FCEL finished out the day yesterday with a hammer candlestick as well as the MACD curling to the upside. White lines are my breakout lines and yellow lines are my price targets…. Happy trading!

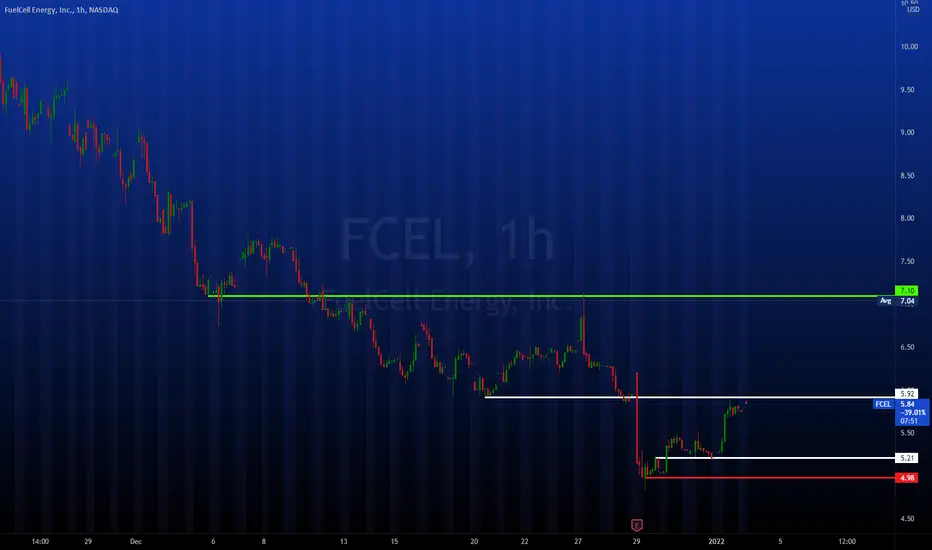
FCEL calls and puts: levels to look for and considerFCEL
Price - 5.78
Support - 5.21
Resistance - 5.92
Consider***
Calls above - 7.1
Puts below - 4.98
Learning from the Alchemist of financial markets "George Soros"“Consider the statement, ‘it is raining.’ That statement is true or false depending on whether it is, in fact, raining. Now consider the statement, ‘This is a revolutionary moment.’ That statement is reflexive, and its truth value depends on the impact it makes.” (George Soros)
What separates George Soros from the rookie traders who are gunning the market right now?
Soros knows how to manage a trade. He knows how to take profits and he isn't just going to sit and hope when the market turns.
That doesn't mean this is an easy game. The risk is high and so is the reward and if you are undisciplined or lazy you will pay a high price.
I wonder what would be the grade of this analysis if George Soros would score these 5 analyses???
A friendly recommendation:
Read George Soros Book The Alchemy of Finance if you have time..!
It will help you to know the difference between stages of a bubble!
Soros bubble theory:
1. At first, the market slides slowly upwards over time in a rational manner before the positive feedback loop accelerates the market
2. The market goes through a test where it drops significantly. If the positive feedback loop is sufficiently strong, the market will overcome the test and continue its climb. At this point, the market will start to disconnect from underlying fundamentals in a big way.
3. The market will continue its climb farther and farther away from the fundamentals. For an equity index, this may be represented by an increase in pricing multiples not warranted by probable future earnings growth.
4. At some point in time, the market will reach a twilight zone where more and more investors become skeptical and bearish. The disconnect between asset prices and fundamentals recognized by some investors will slow down the market appreciation rate.
5. At some point, for some reason, triggered by anything, the positive feedback loop will reverse and become a negative feedback loop. The negative feedback loop will quite swiftly develop into a frantic panic.
Best,
Moshkelgosha

Fuelcell Energy earnings missFuelcell Energy (FCEL) reported a Q4 October 2021 loss of $0.07 per share on revenue of $13.9 million. The consensus estimate was a loss of $0.02 per share on revenue of $21.9 million. Revenue fell 18.0% compared to the same quarter a year ago. FCEL share price is right back where it started last Q3. I reckon if you're a long-term investor, this is a good price to start a small position or add it to your watchlist.
EPS = -$.07
52 week H = $29.44
52 week L = $4.83
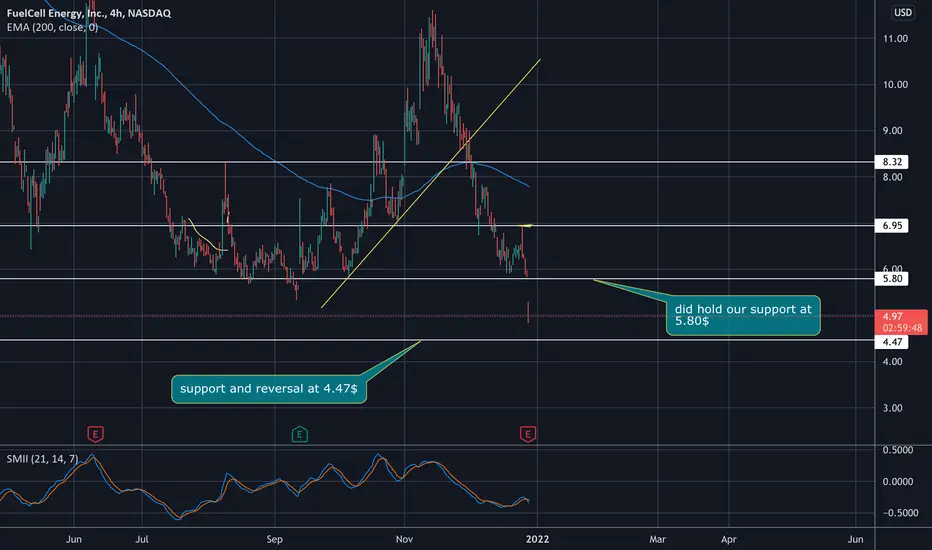
Price levels 4hr chart:
SMA200 = $7.33
SMA150 = $7.69
SMA100 =$8.22
SMA50 =$7.24
Trend channel 4hr chart:
breakout = $7.51
R3 = $7.20
R2 = $6.89
R1 = $6.57
pivot = $6.26
S1 = $5.95
S2 = $5.64
S3 = $5.32
breakdown = $5.01
Do your own due diligence, your risk is 100% your responsibility. This is for educational and entertainment purposes only. You win some or you learn some. Consider being charitable with some of your profit to help humankind. Good luck and happy trading friends...
*3x lucky 7s of trading*
7pt Trading compass:
Price action, entry/exit
Volume average/direction
Trend, patterns, momentum
Newsworthy current events
Revenue
Earnings
Balance sheet
7 Common mistakes:
+5% portfolio trades, capital risk management
Beware of analyst's motives
Emotions & Opinions
FOMO : bad timing, the market is ruthless, be shrewd
Lack of planning & discipline
Forgetting restraint
Obdurate repetitive errors, no adaptation
7 Important tools:
Trading View app!, Brokerage UI
Accurate indicators & settings
Wide screen monitor/s
Trading log (pencil & graph paper)
Big, organized desk
Reading books, playing chess
Sorted watch-list
Checkout my indicators:
Fibonacci VIP - volume
Fibonacci MA7 - price
pi RSI - trend momentum
TTC - trend channel
AlertiT - notification
www.tradingview.com

FCEL 3 buckswe love h2
this will probably bounce hard here after recent earnings dump
i could see 3 bucks next year tho
btfd
NOT TRADING ADVICE

$FCEL gap reversal trade game plan $FCEL gap down cause of bad Q4 earnings, now is heading towards a high valued price at 4.47$, be ready for huge buying pressure if we visited this area .

Plan Accordingly Fibs & $FCEL. This stock is a lot of fun as far as volatility, and can be predictable along with $PLUG. Happy holidays,
SUICIDE PREVENTION (1-800-273-8255)
Happy trading


$FCEL | WEEKLY WATCHLISTUgly drawdown with rest of market last week. $7 needs to hold for me to like this count, although $6.69 is the lower fib. This week will be telling.
